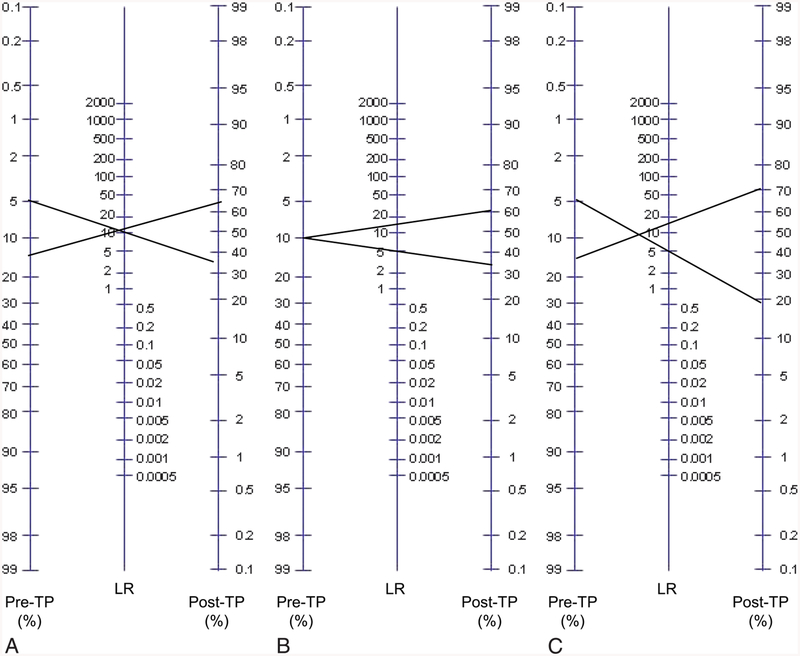
Fig. 1.
Visualizing uncertainty in the Bayes nomogram. The standard Bayes nomogram (adapted from www.CEBM.net) consists of a column of pretest probability (pre-TP) and a column of likelihood ratio (LR) values, and a column of post-TP values. One simply draws a line connecting point estimates of pre-TP and LR of a given test result and extends the line to read the resulting post-TP of disease. Ranges of pre-TP (A), LR (B), or both (C) are shown to illustrate propagation of uncertainty. Note the similar growth of post-TP disease uncertainty when considering component uncertainty in either pre-TP (A) or LR (B). When both steps contain uncertainty, the post-TP range is even larger (C), with the limits being formed by the lower limit of the pre-TP range (5%) mapping through the lower limit of the LR (5), and the upper limit of pre-TP (15%) mapping through the upper limit of LR (15).

