Figure 2.
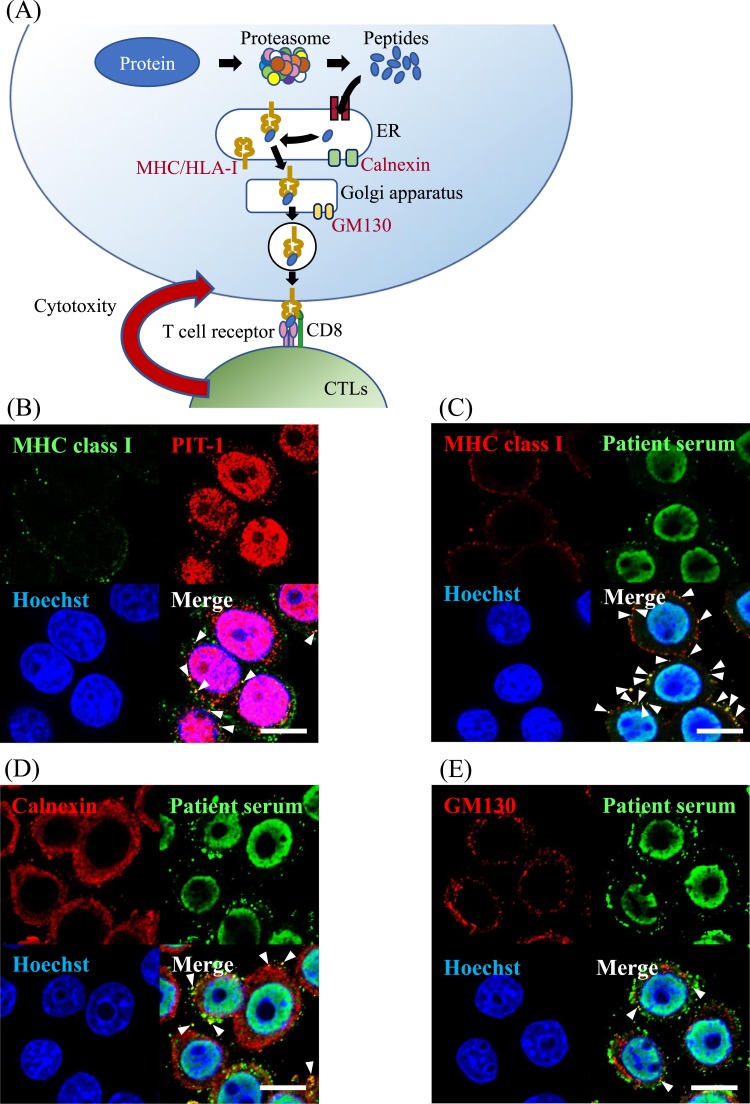
PIT-1 protein was processed in the antigen presentation pathway in GH3 cells. (A) Schematic diagram of MHC/HLA class I antigen presentation pathway. (B) PIT-1 detected by the anti–PIT-1 antibody [15] demonstrated a colocalization with MHC class I molecules. (C) PIT-1 detected by the patient serum [2] demonstrated a colocalization with MHC class I molecules. (D) PIT-1 colocalized with calnexin, which is an ER marker. (E) PIT-1 colocalized with GM130, which is a Golgi apparatus marker. Arrowheads indicate merged signals with each protein. Scale bar, 10 µm.

