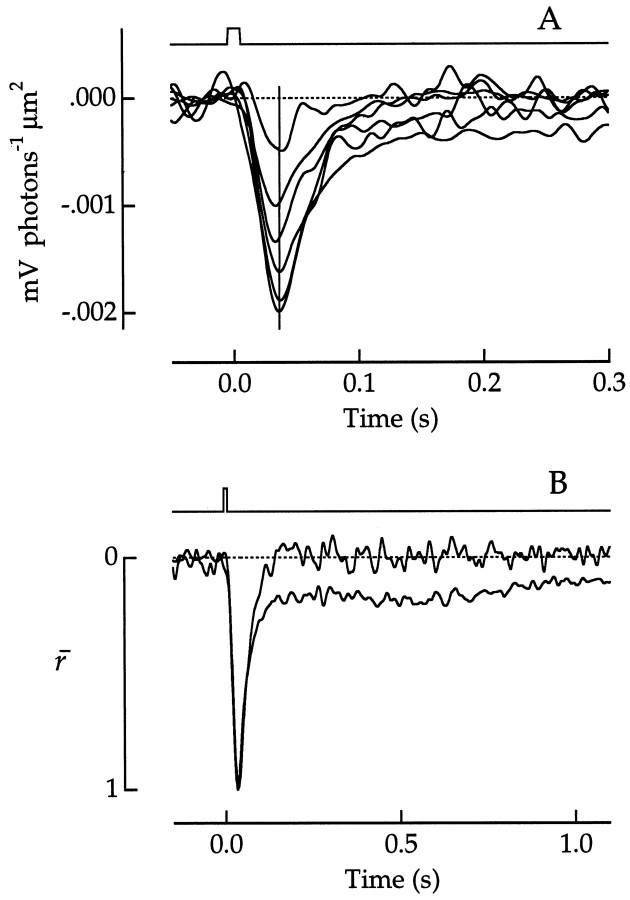
Fig. 12.
Changes in sensitivity and kinetics of photon responses with background illumination in a green cone.A, Flash sensitivity (change in membrane potential photon−1 μm2) as a function of time after the flash is shown. Flash sensitivity to a 500 nm test flash was plotted in the dark-adapted state (largest response) and in the presence of steady background lights of 500 nm at five different background intensities. Test flash photon density (in photon μm−2), background intensity (in photon μm−2 sec−1), and the number of flash responses averaged were 549, 0, 101; 549, 162, 12; 549, 566, 18; 1039, 2642, 12; 1039, 9210, 24; and 1039, 41,540, 5. The vertical line passing through the peak of the responses is positioned at 36 msec. Flash duration was 10 msec. The flash monitor is shownabove the responses. B, For comparison of the waveforms, flash sensitivities in the dark-adapted state and in the presence of the second brightest background were normalized to the same peak height. Note the difference in the timescales of Aand B. Bandwidth, DC–30 Hz.

