
Fig. 13.
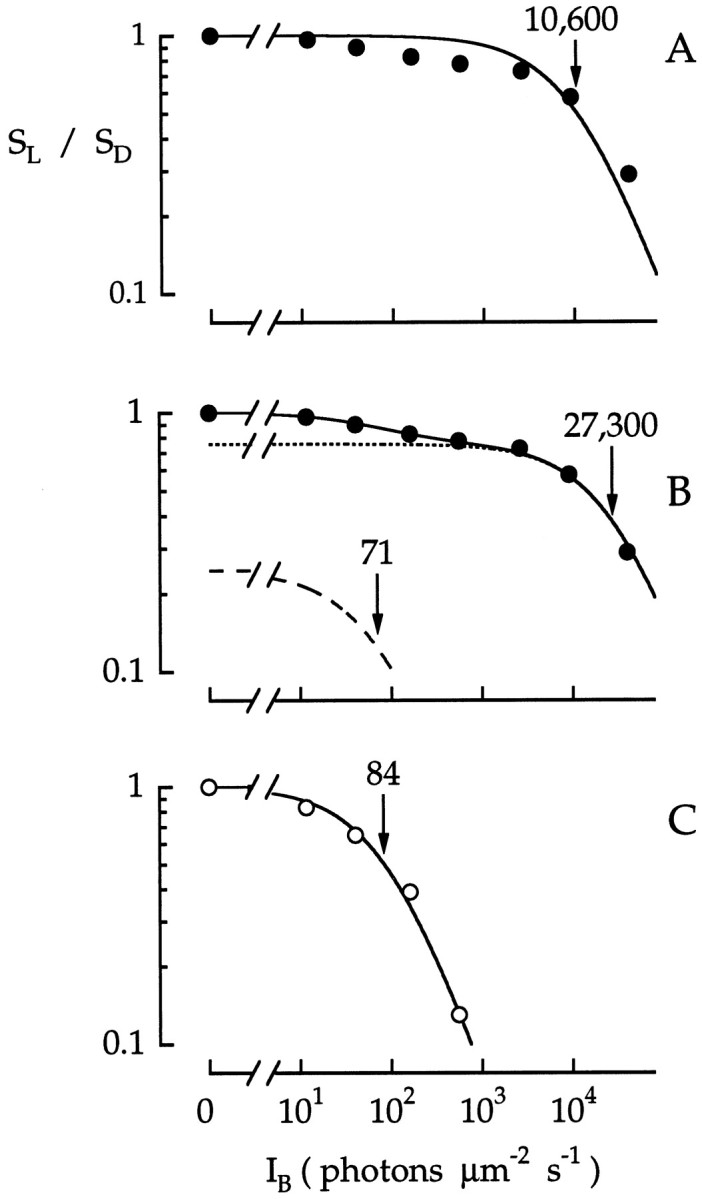
Intensity dependence of background desensitization in a green cone. Points plot peak flash sensitivity to a 500 nm test flash (SL), normalized to the dark-adapted sensitivity (SD) as a function of the intensity of a 500 nm background light (IB). Some of the responses used for these data are shown in Figure 12. SL andSD were compared in interleaved trials; no significant reduction in SD was observed between trials. A, B, Points (•) plot normalized sensitivity at the peak of the response. The solid curve in A is the least-squares fit of the points to a Weber–Fechner function (Eq. 2) withI0 = 10,600 photons μm−2 sec−1. The solid curve in B is the weighted sum of two Weber–Fechner functions given by Equation 3 with α = 0.75,IR0 = 70.8 photons μm−2 sec−1, andIC0 = 27,300 photons μm−2 sec−1. The putative rod and cone contributions that comprise the weighted function are plotted by the dashed and dotted curves, respectively. C, Points (○) plot normalized sensitivity measured at 300 msec. The solid curve is the least-squares fit of the points to a Weber–Fechner function (Eq. 2) withI0 = 84 photons μm−2sec−1.