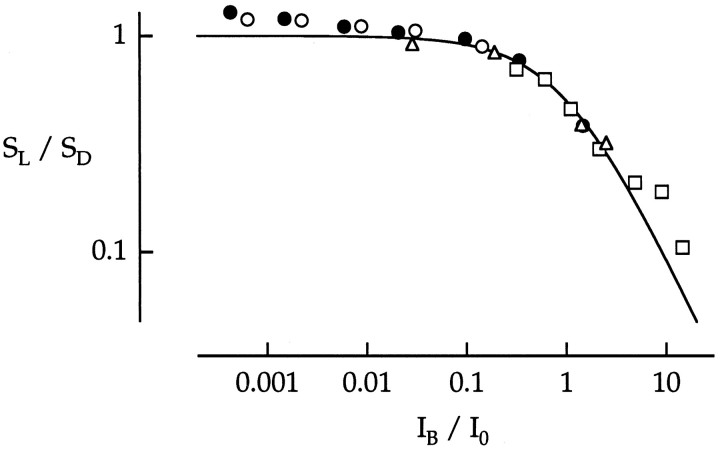
Fig. 14.
Background desensitization measured in four cones. Peak flash sensitivity as a function of background intensity was plotted on normalized axes. Each symbol type is from a different cone. Data from each cone were normalized on they-axis so that the low-intensity cone plateau was set to a normalized sensitivity value of 1. I0 is the percent background intensity for each cone that halved the sensitivity of the dark-adapted cone component. The values ofI0 (in photons μm−2sec−1) and the cone types were as follows: 14,600, red (▵); 2910, red (○); 14,800, green (•); and 2320, green (■). The smooth curve is from Equation 2.

