
Fig. 15.
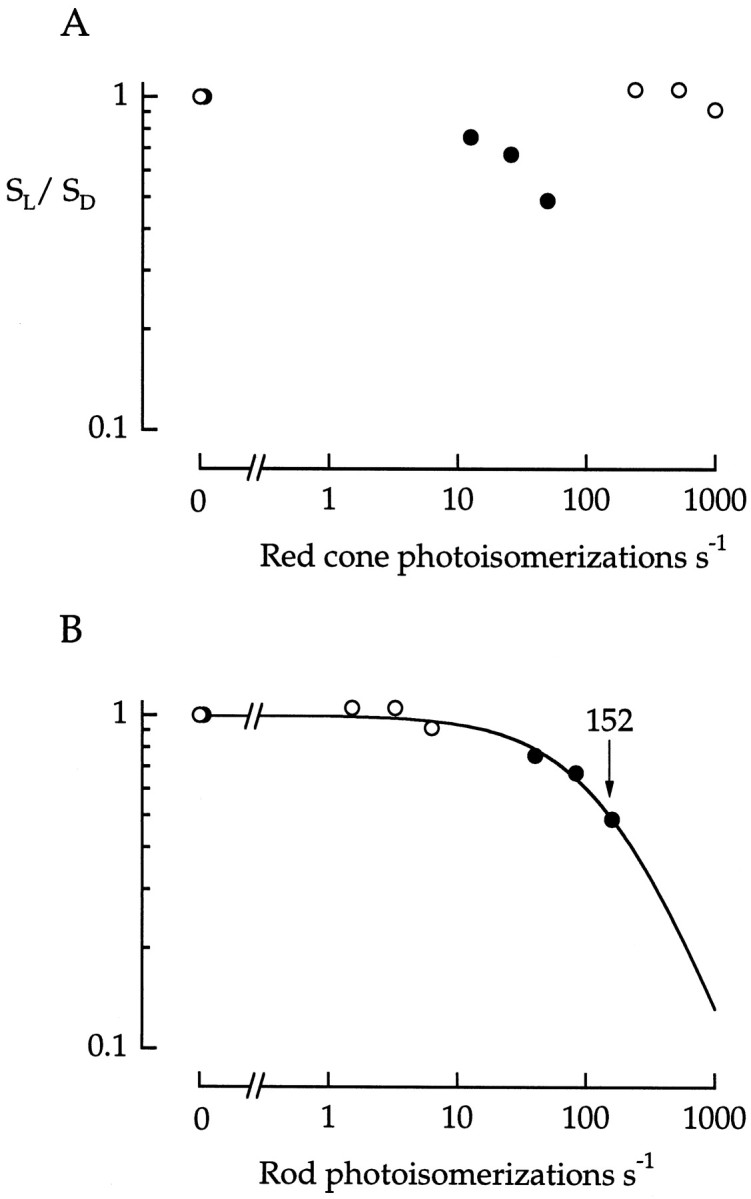
Spectral sensitivity of background desensitization. Peak flash sensitivity was measured as a function of background strength in a red cone. Flash wavelength was 500 nm. Background wavelength was 500 nm (•) or 660 nm (○).A, Background strength is plotted as the rate of photoisomerization in red cones. B, Background strength is plotted as the rate of photoisomerization in rods. The smooth curve in B is the least-squares fit of the points to Equation 2 with I0 = 152 photoisomerizations sec−1.