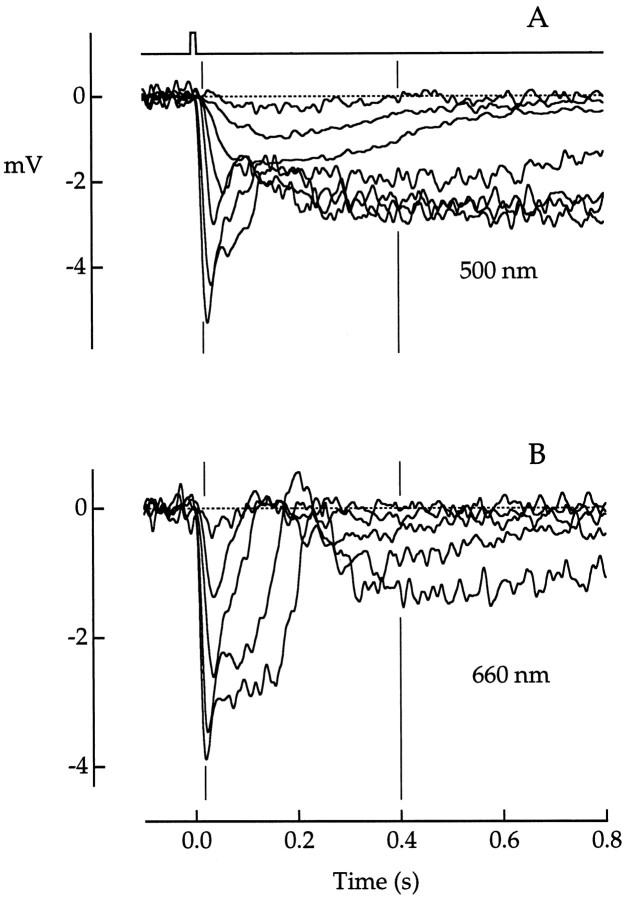
Fig. 2.
Dependence of response waveform on wavelength.A, B, Superimposed responses of a red cone to flashes of increasing strength at wavelengths of 500 nm (A) and 660 nm (B).Vertical lines indicate the time points at which response amplitudes were measured for plots shown below (see Fig. 3, 18 and 400 msec). Flash photon densities increased by a factor of approximately four between traces and ranged from 8 to 3.07 × 10⁴ photons μm−2at 500 nm and from 5.55 × 10³ to 1.39 × 10⁶ photons μm−2 at 660 nm. Flash duration was 10 msec. The flash monitor is shownabove the voltage traces inA. Voltage traces plot averages of 1–16 responses. Bandwidth, DC–50 Hz.

