Fig. 3.
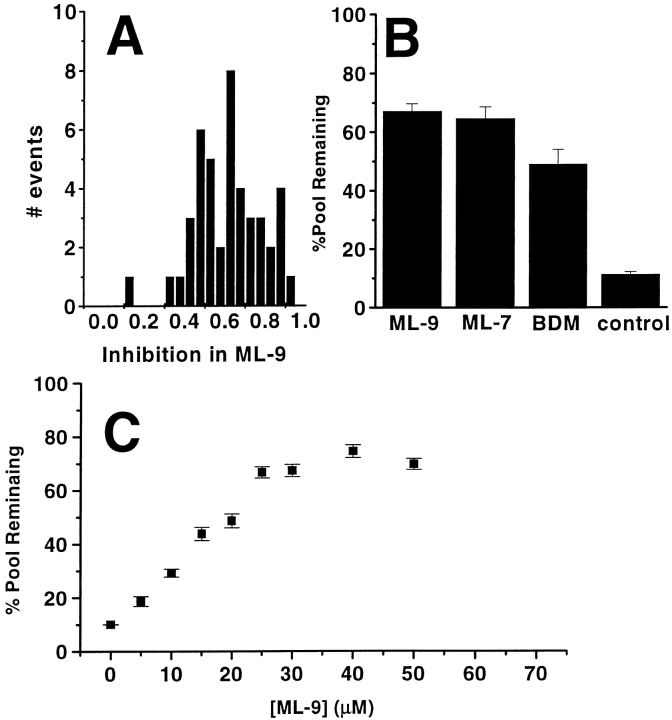
Inhibition of vesicle pool mobilization by MLCK or myosin inhibitors. The degree of inhibition from a typical experiment as in Figure 1 was measured over a population of 44 synaptic boutons. To control for possible rundown, I performed an additional control run of loading and unloading. Boutons were selected for measurement on the basis of their appearance in both control runs. A, Histogram of ML-9 inhibition in a single experiment. Inhibition is defined as (1 − ΔFML-90/ΔFcontrol0), where ΔFcontrol0 is the average fluorescence signal of the two control runs. B, Percentage of vesicle pool remaining after 900 AP in 30 μm ML-9, 15 μm ML-7, 25 mm BDM, or control saline. All three inhibitory conditions reduce the number of vesicles turned over during prolonged AP stimuli. Slightly longer wash-in and washout times (4 min) were used for experiments with ML-7, a more hydrophobic compound than ML-9. Each concentration was measured in at least two experiments over 40–120 boutons. C, Dose–response relationship of ML-9 inhibition shown as the fraction of the recycling vesicle pool remaining after 900 AP unloading stimuli. The maximal block by ML-9 saturates for [ML-9] >25 μmand shows a half-maximal inhibition of ∼12.5 μm. The inhibition at each concentration was measured in at least three separate experiments over a total of 75–95 boutons.

