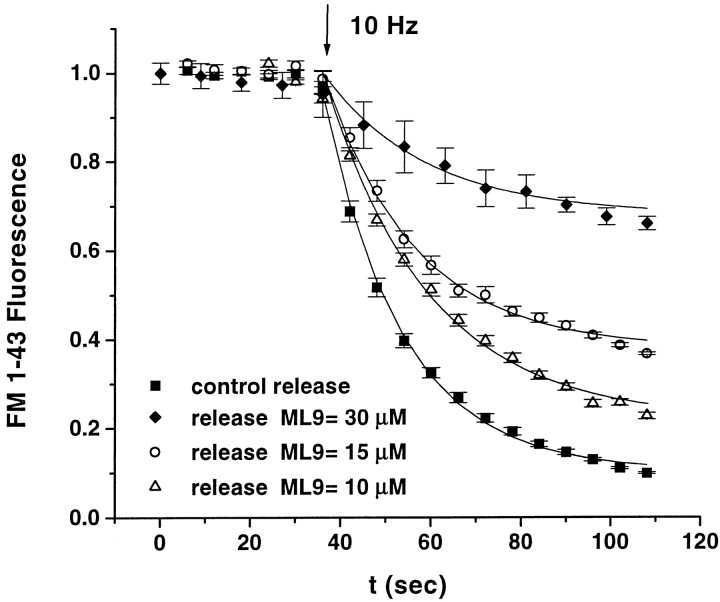
Fig. 5.
Kinetics of vesicle pool turnover during MLCK inhibition. Synaptic boutons were loaded with FM1-43, using long AP stimuli, before measuring the kinetics of release of the dye in the presence or absence of varying concentrations of ML-9 (amplitude, ΔF0 in schematic of Fig. 1). A second round of stimulation released the remaining fluorescence after inhibitor washout (amplitude, ΔF1 in schematic of Fig. 1). For each bouton the fluorescence was normalized to ΔFT, the total releasable fluorescence signal from both rounds of unloading. Shown here are population averages of dye release kinetics from populations of boutons of individual experiments in control saline, 10 μm ML-9, 15 μm ML-9, and 30 μm ML-9. The 15 μm and control experiments were performed sequentially on the same boutons, whereas the data for each of the other concentrations were obtained from different experiments. The accompanying control runs for [ML-9] = 10 μm and [ML-9] = 30 μmwere identical to that for the 15 μm run (data not shown). Fluorescence intensity kinetics for each boutoni were fit by using the equationFi(t) = ΔF0e−(t−t0)/αi+ ΔF1, wheret0 marks the start of the stimulus and ΔF0 and ΔF1were fixed as the total fluorescence loss during each run. The following values were obtained for the decay constants: control saline, <α> = 17.7 ± 0.4 sec (n = 39); [ML-9] = 10 μm, <α> = 21.3 ± 1.2 sec (n = 39); [ML-9] = 15 μm, <α> = 20.1 ± 1.3 sec (n = 40); [ML-9] = 30 μm, <α> = 22.8 ± 1.6 sec (n= 25), where the brackets indicate the average value obtained over all αi, and n is the number of boutons measured for each experiment. At [ML-9] = 30 μm, certain boutons release too little fluorescence to extract kinetic parameters (some boutons are near complete inhibition at this concentration; see Fig. 3A). These were excluded from the kinetic analysis performed here. The average inhibition in these data is 22 ± 1.8% ([ML-9] = 10 μm), 35 ± 1.2% ([ML-9]= 15 μm), and 58 ± 2.4% ([ML-9] = 30 μm). The solid line showsF(t), using the average values of α obtained in each case.

