
Fig. 1.
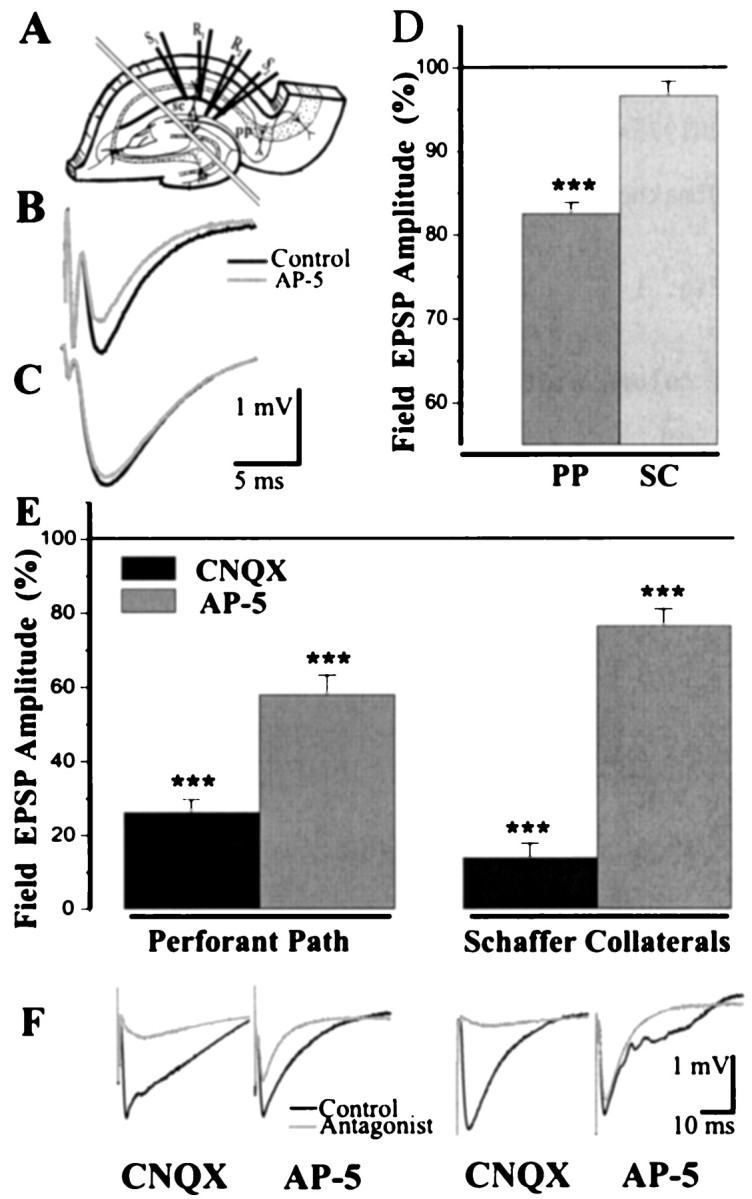
Differences in the pp and sc fEPSP.A, Electrode positions for the simultaneous pp and sc fEPSP recording. Parallel lines signify the cut made to isolate the inputs. B, An example of the pp fEPSP in regular ACSF and the effect of NMDA receptors blockade.C, The sc fEPSP in regular ACSF shows no substantial effect of NMDA antagonist. D, Averaged data on the effect of NMDA antagonist ± AP-5 (100 μm) on the pp and sc fEPSP amplitude in regular ACSF. E, Averaged data on the effect of NMDA and AMPA antagonists on the pp and sc fEPSP amplitude in low Mg2+, picrotoxin, and tetrodotoxin containing ACSF. Horizontal lines (100%) represent the fEPSP amplitude before drug application. Data in columns were taken at 10 min after the start of application. Significance in paired t test: ***p < 0.001. F, Field EPSP traces from individual experiments with NMDA and AMPA antagonist applications in low Mg2+, picrotoxin, and tetrodotoxin containing ACSF. Pathway labels below Ealso refer to F.