
Fig. 11.
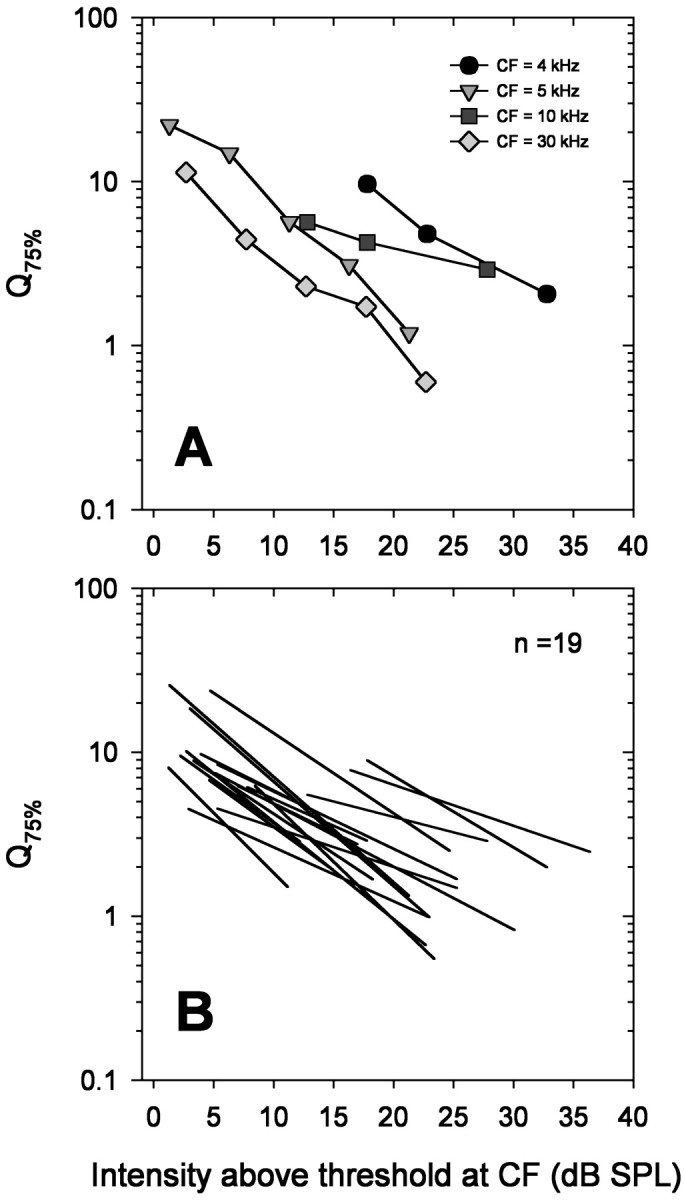
Frequency selectivity decreases with increasing intensity. A, The Q75% values of four representative ARFs are plotted as a function of increasing intensity above threshold at CF with different symbols and shades ofgray. B, The changes ofQ75% values with increasing intensity for a larger number of ARFs (n = 19) are plotted as slopes of regression lines of log Q75% versus intensity. Regression lines were calculated from three to five values for each ARF.