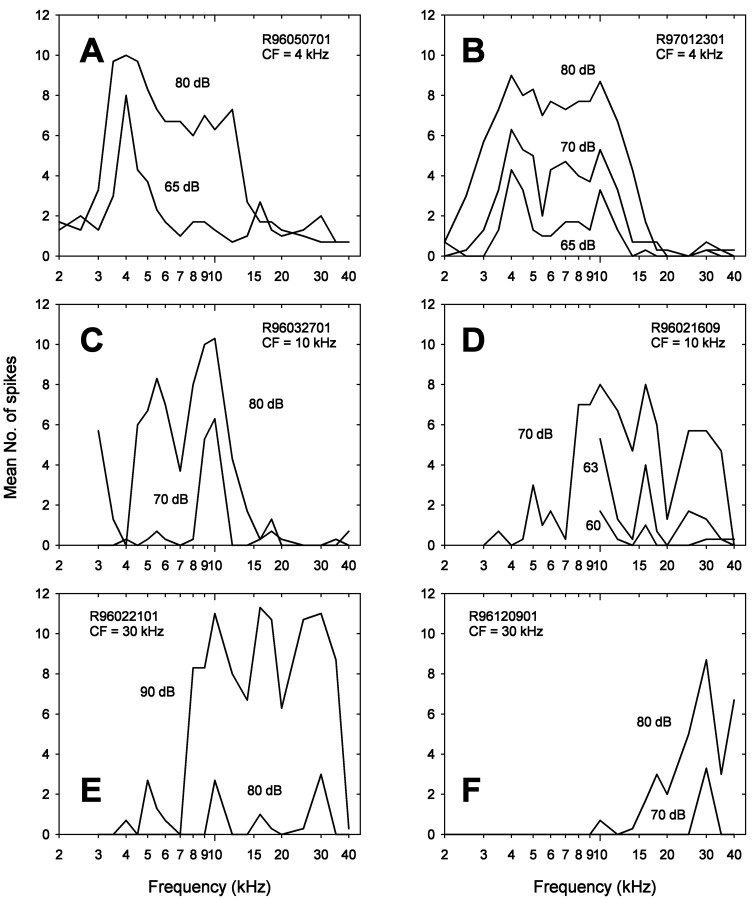
Fig. 3.
Iso-intensity curves of six representative ARFs. The mean number of spikes from three responses is illustrated as a function of frequency. ARF identifications and their CFs are shown on the top left or right. Stimulus intensity is given beside each iso-intensity curve.A and B are low-frequency ARFs.C and D are mid-frequency low- and high-pass ARFs, respectively. E and F are ultrasound ARFs. See Results for further explanation.

