
Fig. 6.
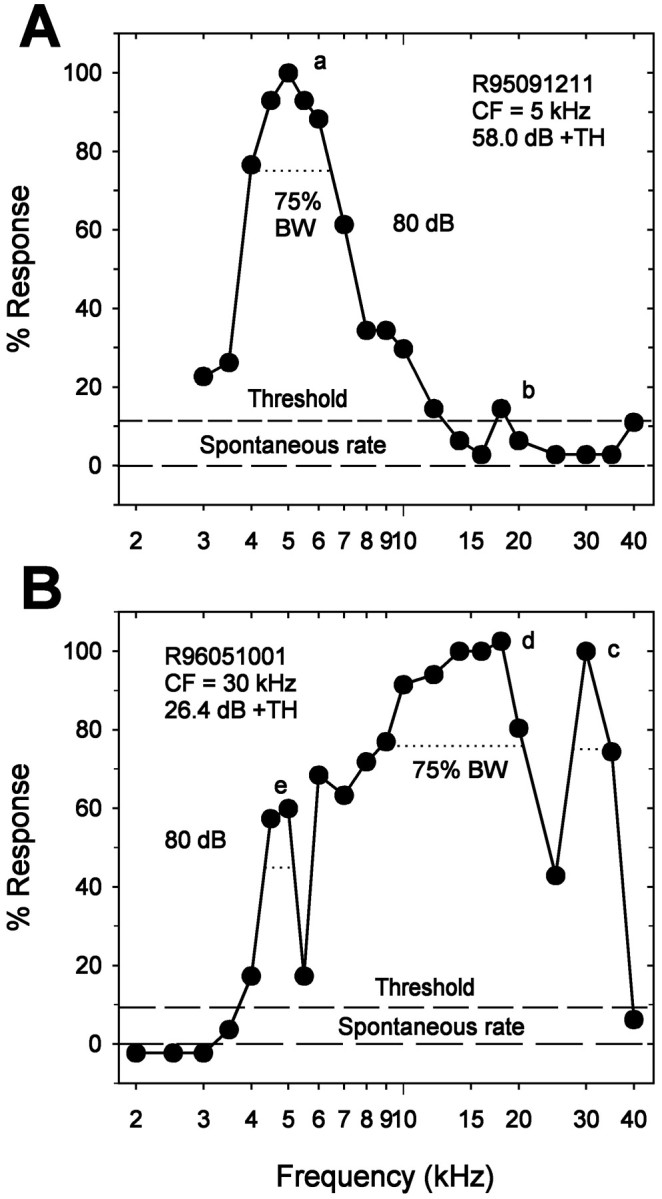
Criteria for sensitivity peaks. Iso-intensity responses were normalized to the number of spikes at BF (see Materials and Methods) after spontaneous rate was subtracted. Sensitivity peaks occurred at frequencies that elicited responses above threshold levels (see Materials and Methods) and were flanked by troughs in which the responses dropped to 75% of the peak. Peaks in A(a) and B(c) occurred at BF. Additional sensitivity peaks occurred at A (b) andB (d, e). Spontaneous rates, threshold, and 75% bandwidth (75% BW) are illustrated by different dashed lines. ARF identifications, CFs, and sound intensity above threshold (+TH) are given at the top left orright. Both A and B are iso-intensity curves at 80 dB. A, Low-frequency ARF with unusually low threshold and long latency. This ARF maintained its frequency selectivity, even at nearly 60 dB above threshold.B, Ultrasound ARF. This ARF was almost equally sensitive to 16 and 30 kHz at threshold. Additional sensitivity peaks occurred at 5 and 18 kHz.