
Fig. 2.
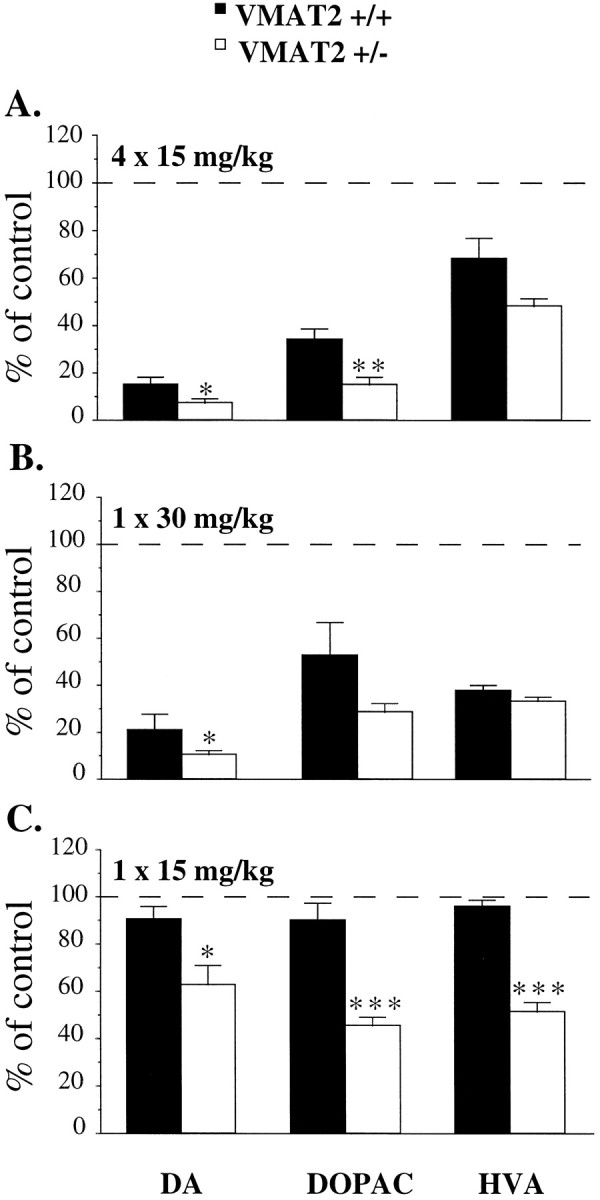
Effects of METH on striatal DA and metabolite content after different paradigms of administration and dosing regimens. A, Two-day post-METH administration. Animals were treated with METH (4 times at 15 mg/kg, s.c., each given 2 hr apart) and killed 2 d after the last injection. The data are presented as percentages of saline-treated controls, which were as follows: 15.6 ± 1.4, 1.08 ± 0.01, and 1.39 ± 0.1 ng/mg wet tissue in wild-type mice; 14.3 ± 1.2, 1.4 ± 0.3, and 1.47 ± 0.2 ng/mg wet tissue in VMAT2 +/− mice for striatal DA, DOPAC, and HVA, respectively. B, C, Seven-day post-METH administration. Animals were treated with a single subcutaneous injection of METH at 30 (B) or 15 (C) mg/kg and killed 7 d after injection. The data are presented as percentages of saline-treated controls, which were as follows: 20.7 ± 0.8, 1.2 ± 0.1, and 1.4 ± 0.1 ng/mg wet tissue in wild-type mice; 15.6 ± 1.2, 1.5 ± 0.1, and 1.5 ± 0.1 ng/mg wet tissue in VMAT2 +/− mice for striatal DA, DOPAC, and HVA, respectively. DA and metabolite levels were determined using HPLC-EC as described in Materials and Methods. Values represent the mean ± SEM of four to five independent determinations. **p < 0.01; *p< 0.05 versus METH-treated wild-type animals.