
Fig. 3.
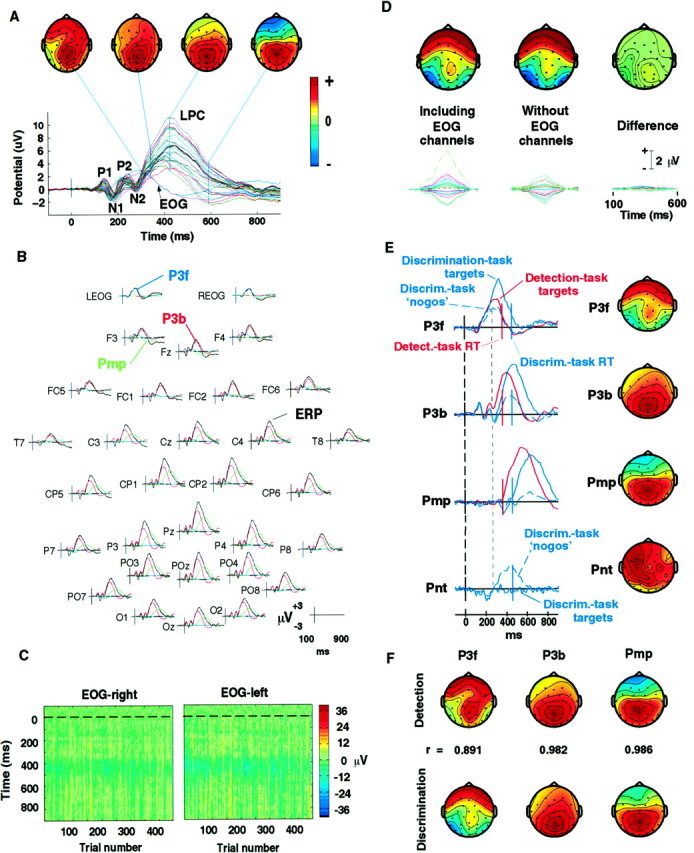
A, The scalp distribution of the LPC evoked by attended visual stimuli is not spatially fixed. Grand mean evoked response to detected target stimuli in the detection task (average of responses from 10 subjects and five attended locations). Response waveform at all 29 scalp channels and two periocular channels (EOG) are plotted on a common axis. Topographic plots of the scalp distribution of the response at four indicated latencies show that the LPC topography is labile, presumably reflecting the summation at the electrodes of potentials generated by temporally overlapping activations in several brain areas, each having broad but topographically fixed projections to the scalp. All scalp maps are shown individually scaled to increase color contrast with polarities at their maximum projection, as indicated in the color bar.B, Separate projections of the three major LPC components (colored traces) overplotted on the grand mean target response (black traces) for the detection task. Note the large projection of the P3f component (blue trace) at the two periocular electrodes (top traces) and its smaller projection at Pz and the polarity reversal of component Pmp (green traces) between central and frontal channels. C, Single target-response trials at the periocular electrodes (see Materials and Methods) for one subject in the detection task (all five locations), plotted asvertical colored lines (color code onright). Before plotting, noise and movement artifacts were removed from each trial by subtracting ICA components accounting for eye artifact, line, and muscle noise from a 31-channel decomposition of the single-trial data (Jung et al., 1998). An early broad positivity (yellow band) appeared between 200 and 350 msec in most trials, with near constant amplitude, latency, and duration. D, Separation of P3f was not affected by omitting the two periocular channels. Separate ICA decompositions of 25 grand-mean (figure legend continues) detection-task ERPs (10 subjects) using first (left) all 31 channels, and then (center) 29 scalp channels alone, identified nearly identical P3f components (right). Scalp maps plotted on the same relative scale, with polarities as in A (bottom traces). Projections of the P3f component and their difference (bottom right) on the same microvolt scale. E,Activation time courses and scalp maps of the four LPC components produced by the ICA algorithm applied to 75 1 sec grand-mean (10-Ss) responses from both tasks. Map scaling as inA. Because microvolt scaling information for each ICA component is divided between its activation and its scalp map, units are not indicated (see Results). The thick dotted line(left) indicates stimulus onset. Mean subject-median RTs in the detection task (red) and discrimination task (blue) are indicated by solid vertical bars. Three independent components (P3f, P3b, Pmp) accounted for 95–98% of LPC variance in both tasks. In both tasks, median RT coincided with Pmp onset. Pnt, a fourth, left-frontocentral component, was evoked mainly after nogo nontargets presented in the attended location in the discrimination task. The faint vertical dotted line at ∼250 msec shows the temporal relationship between the onsets of Pnt and P3b and the divergence of the P3f activations after target and nogo stimuli in the discrimination task. F,Separate ICA decompositions of ERPs from the detection and discrimination tasks gave similar LPC components. For all three components, both the scalp maps (shown) and periods of activation (data not shown) were nearly equivalent. Correlations between the respective component scalp maps are indicated. Maps individually scaled as inA.