
Fig. 5.
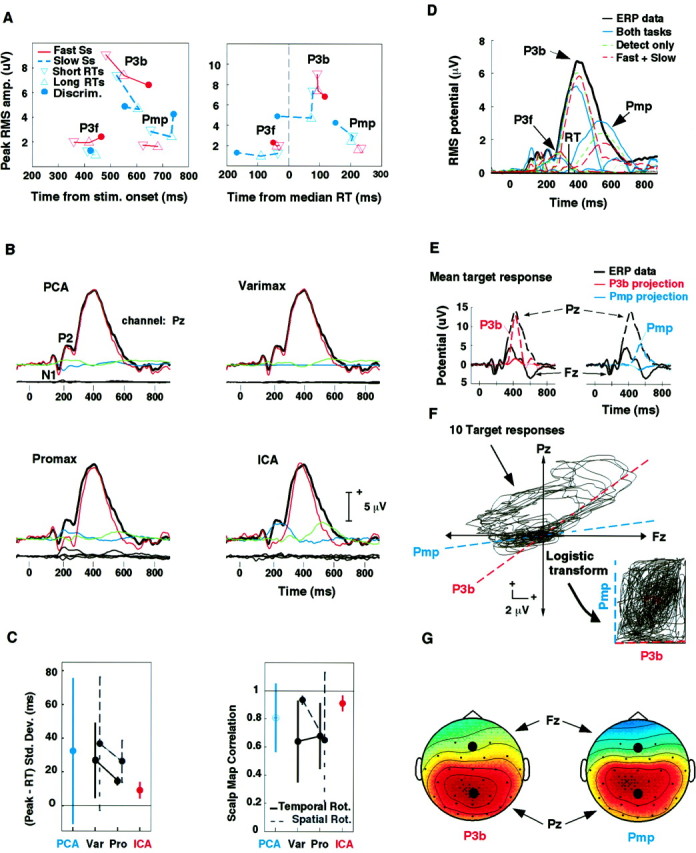
A, LPC component peak amplitudes and latencies plotted relative to target stimulus onset (left panel) and to median RT (right panel). Peak latencies of all three LPC components were tied to RT in the fast-responder averages only. B,Comparison of ICA and PCA-based decompositions. Sets of 30 fast-responder and slow-responder detection-task response averages (compare Fig. 4) were separately decomposed using PCA (top left). The largest seven principal components were then rotated by Varimax (top right) and Promax (bottom left) applied either to their activation time courses (shown here) or to their spatial maps (eigenvectors) (data not shown). The figure shows envelopes of the grand-average short-RT target response for the fast responders (black traces) with envelopes of the respective component projections (colored traces) superimposed. The temporal Varimax and Promax rotations, shown here, appear to approach the ICA decomposition, although the ICA decomposition appears most parsimonious. See Results. C,ICA components were more stable and more tightly linked to behavior than analogous PCA-based components. The left panelshows means and SDs of the RMS millisecond difference between component peak latency and median RT (averaged across two subgroup decompositions and three LPC components and two RT-separated data subsets). Theright panel shows mean and SD scalp map correlations between analogous (figure legend continues) component pairs in the fast-responder and slow-responder response decompositions (averaged across the three LPC components). ICA component latencies were more tightly linked to behavior, and their scalp maps better correlated between subject groups, than the PCA-based components. D, Relative stability of the ICA decomposition. Comparison of the envelopes of the projections of the three LPC components of the grand-mean (all 10 subjects) detection-task target response derived by three ICA decompositions involving this data. Although each decomposition was dominated by three LPC components, relative component peak latencies were more stable between decompositions than peak amplitudes. Vertical bars: median RT. See Results. E–G, ICA identifies spatially periods of fixed scalp topography. Decomposition of 30 detection-task response means for the slow-responder subgroup produced two large LPC components, P3b and Pmp. F, A scatter plot of the short-RT and long-RT target responses (separately at five attended locations) (middle panel) at two scalp electrodes, Fz and Pz, contains two strongly radial (i.e., spatially fixed) features. The dashed lines show the directions associated with components P3b and Pmp in these data, as determined by (G) the values of their respective component scalp maps (black dots). Thus, ICA separated out two important spatially fixed components of the input data using its (nonGaussian) higher-order statistics. E, Projections of components P3b and Pmp of the grand mean target response onto the same two scalp channels (top panel, colored traces), overplotted on the grand-mean response waveforms (black traces), indicate that the two components, P3b and Pmp, dominate the central and late portions of the LPC, respectively. Infomax ICA found the two component directions by maximizing joint entropy (i.e., the evenness of the density distribution) of a nonlinear transform of the (31-channel) unmixed data (center right insert). See .