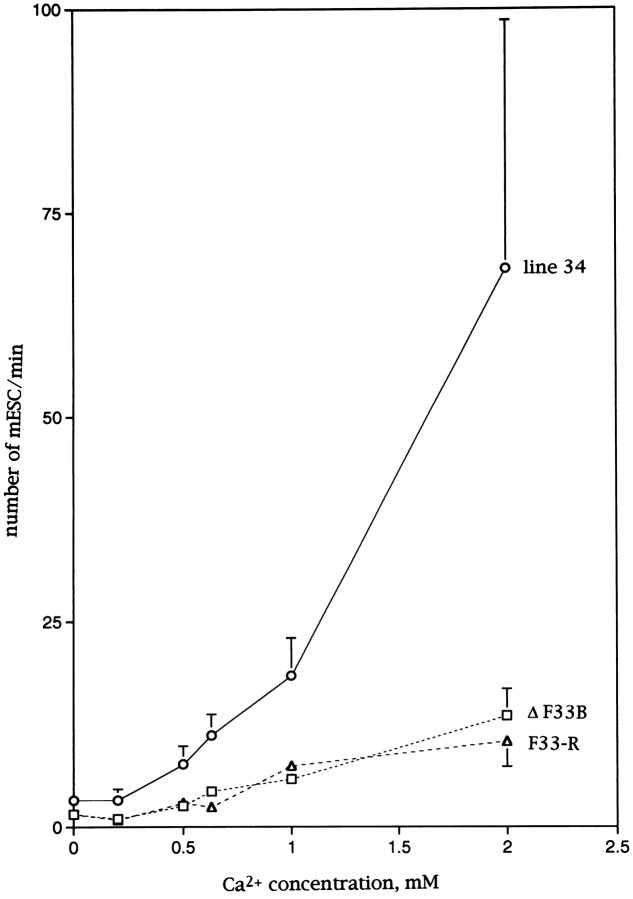
Fig. 1.
The relation between the frequency of mESCs and external Ca2+ concentration in the 20 mmK+ solution in the presence of 3 μmTTX. The frequency was plotted against external Ca2+concentration. Open circles are for line 34 larvae,squares are forn-sybΔF33B, andtriangles are forn-sybF33-R. Error bars indicate SEM. Neighboring data points were connected by straight lines.

