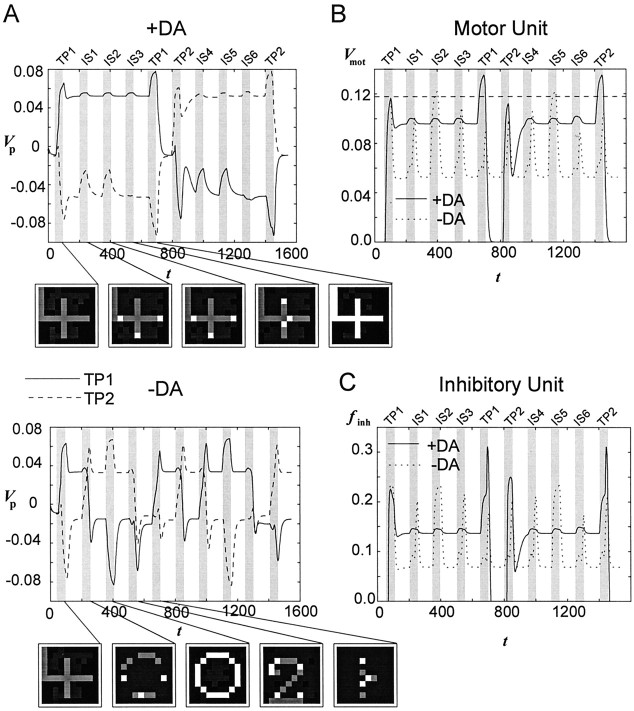
Fig. 2.
Activity of the PFC network under conditions of normal (+DA) and reduced (−DA) DA unit output during two successive trials of a DMS task with intervening stimuli. A, Mean proximal membrane potential (top parts) of all PFC net units belonging to the pattern “4,” which is the TP in the first trial (TP1), and pattern “0,” which is the TP in the second trial (TP2).Gray bars indicate the time intervals during which stimuli were presented. Three intervening stimuli (IS1–IS3 andIS4–IS6, respectively) were presented between the first (sample) and the second (matching) presentation of a TP. Note thatIS1 = IS2 = TP2 andIS4 = IS5 = TP1. Bottom parts give the gray level-coded membrane potential of all 100 PFC network units at discrete time points during presentation of the stimuli in the first trial. Lighter gray levels indicate higher activity. With normal DA output, TPs stay stable during a whole trial (+DA), whereas intervening patterns override currently active patterns under conditions of reduced DA unit output (−DA). Iaff = 0.55.B, Membrane potential of the motor unit under the+DA and the −DA conditions. C, Mean firing frenquency of the inhibitory unit under the +DA and the −DA condition.

