
Fig. 10.
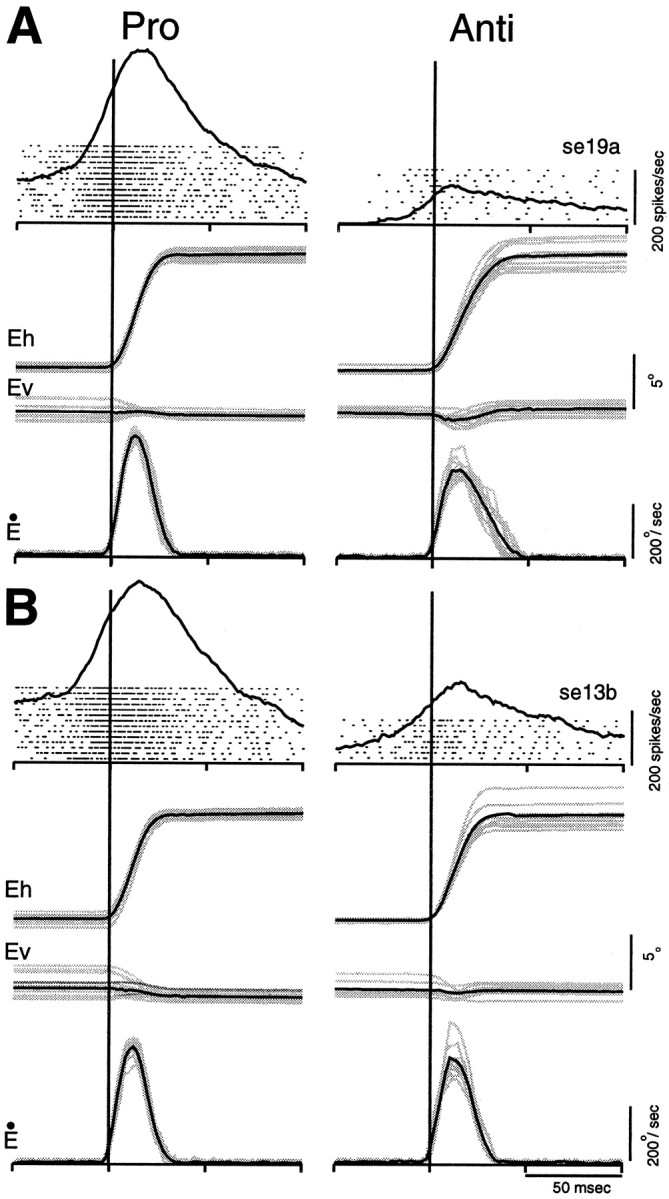
Comparison of saccade-related activity in two individual SC neurons for pro-saccades and anti-saccades.A, Neural activity of a burst neuron aligned on the onset (vertical lines) of pro-saccades (left panel) and anti-saccades (right panel). Each dot indicates the time of an action potential relative to saccade onset, and each row represents one trial. Superimposed on the rasters is the average activation waveform. The horizontal (Eh) and vertical (Ev) eye positions and the radial velocities (Ė) are shown below.Gray lines indicate individual trials and black lines indicate averages. B same asA, but for a buildup neuron.