Figure 4.

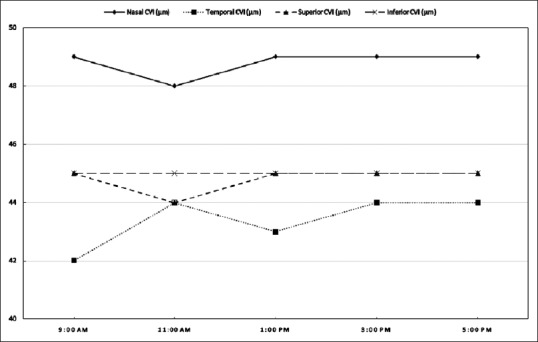
The graphical representation of the variation in peripapillary choroidal vascularity index (CVI) (shown as percentage) in all the four quadrants

The graphical representation of the variation in peripapillary choroidal vascularity index (CVI) (shown as percentage) in all the four quadrants