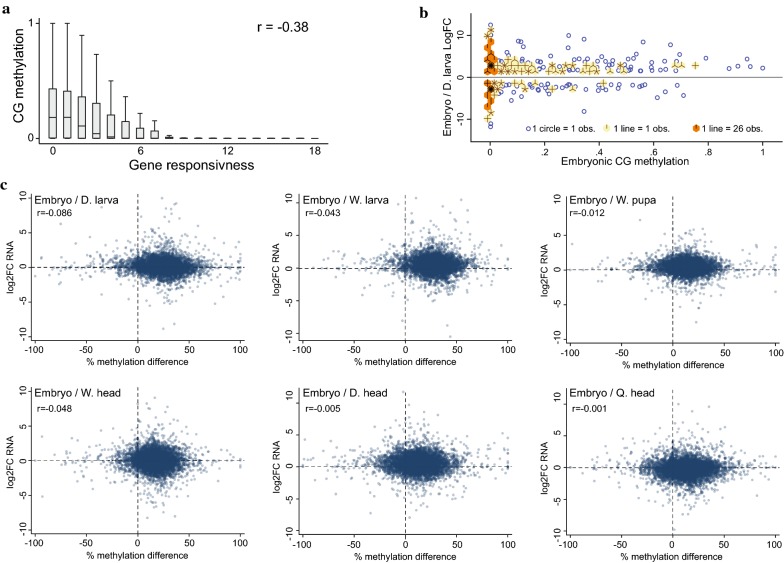
Fig. 4.
Gene body methylation dynamics are not associated with developmentally regulated transcriptional profiles. a Boxplot of averaged genic CG methylation in embryos over gene responsiveness (the breadth of expression of a gene across multiple developmental stages). Gene responsiveness was calculated using the complete transcriptome array of this study. A gene with responsiveness level of zero means that it was found to be similarly expressed in all developmental stages, whereas a gene with responsiveness level of 21 means that it was found to be differentially expressed in all pairwise comparisons among the seven developmental stages. b Sunflower (density) scatter plot of LogFC of RNA reads of DEGs between embryo and D. larva versus averaged genic CG methylation in embryos. Obs. equals observations. c Scatter plots of LogFC of RNA versus percent-methylation-change between indicated samples. r represents Pearson Correlation Coefficient value

