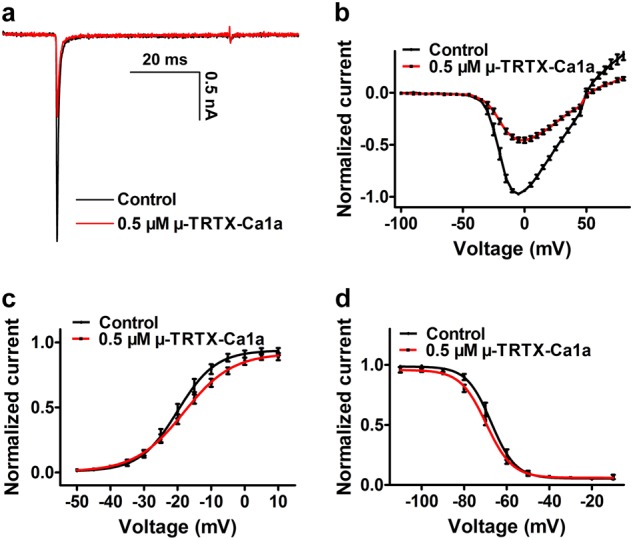
Fig. 4.

The inhibition of Ca1a on Nav1.7 expressed in HEK293T cells. a Inhibition of Nav1.7 currents by 0.5 µM Ca1a. b Current–voltage (I–V) curve for the Nav1.7 channel before (black) and after (red) application of 0.5 µM Ca1a (n = 10). c Conductance–voltage (G–V) curve for the Nav1.7 channel before (black) and after (red) application of 0.5 µM Ca1a (n = 10). d Steady-state inactivation of the Nav1.7 channel before (black) and after (red) treatment with 0.5 µM Ca1a (n = 10). Means ± SEM
