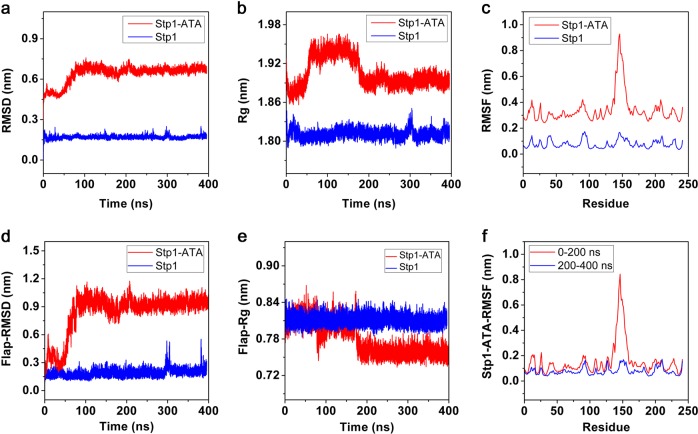
Fig. 2.
Values for the apo–serine/threonine phosphatase (Stp1) model (blue) and Stp1–aurintricarboxylic acid (ATA) complex (red) model were calculated using Gromacs version 5.0.2. a Root mean square deviation (RMSD) values of Cα backbone in both models. b ATA complex Radius of gyration (Rg) values of Cα backbone in both models. c Root mean square fluctuation (RMSF) values of every residue in two models during entire molecular dynamics (MD) simulations. d RMSD values of the Cα of flap subdomains in both models. e Rg values of the Cα of flap subdomains in both models. f RMSF values of every residue in Stp1–ATA complex model during 0–200 ns and 200–400 ns

