Fig. 3.
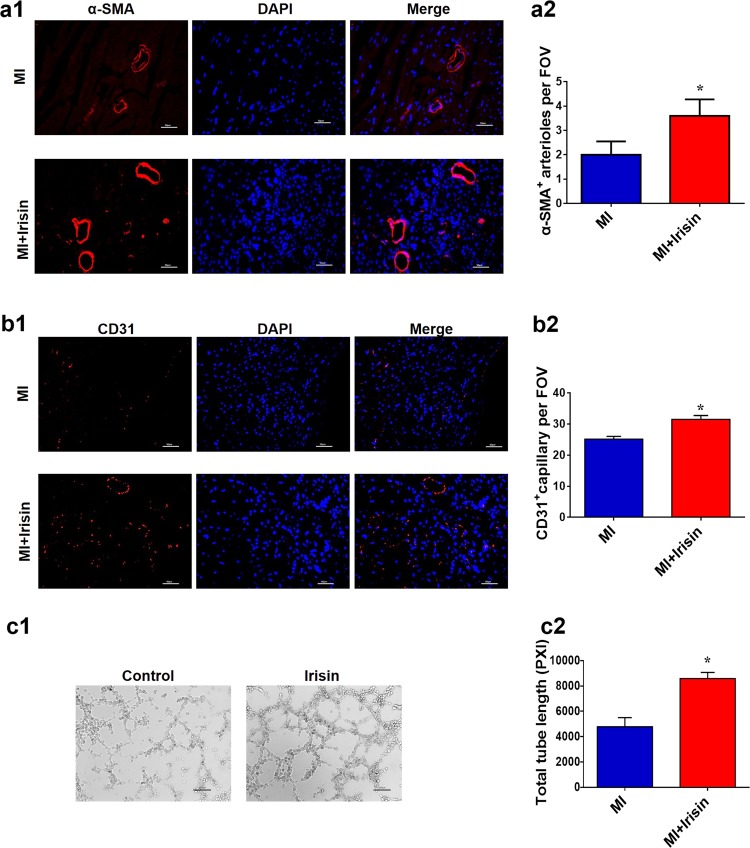
Irisin promoted angiogenesis in post-MI hearts. a Representative angiogenesis images and quantification of α-SMA+ arterioles per FOV (field of view) ratio in the infarct border zone with immunostaining of the smooth muscle cells, n = 6, scale bar = 50 μm. b Representative angiogenesis images and quantification of CD 31+ capillary per FOV ratio in the infarct border zone with immunostaining of endothelial marker CD31 n = 6, scale bar = 50 μm, *P < 0.05 vs. control. c Representative images of endothelial cell tube formation assay with HUVECs in vitro. n = 3, scale bar = 100 μm, *P < 0.05 vs. control

