Fig. 5.
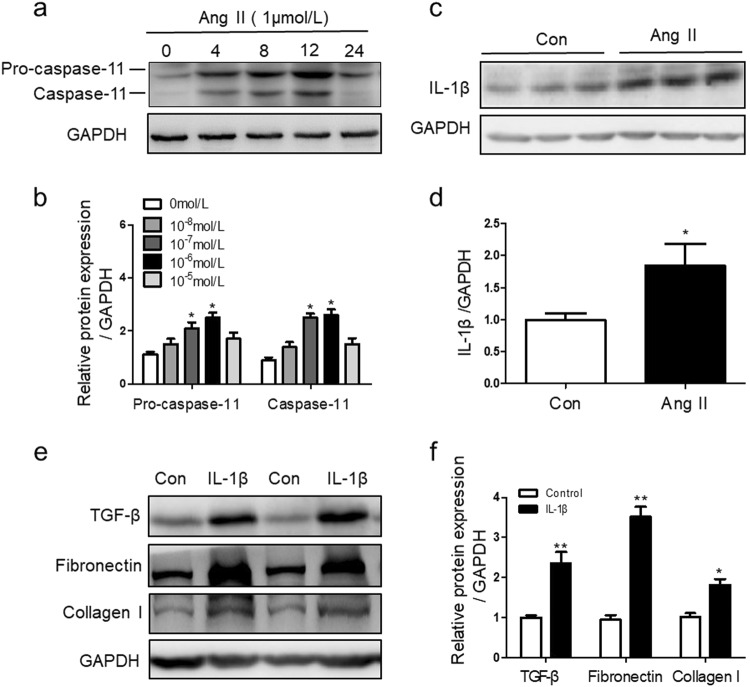
Ang II stimulated caspase-11 and IL-1β expression. a Cells were stimulated with 1 μmol/L Ang II for 0–24 h. Caspase-11 was analyzed by western blotting. b Quantification of pro-caspase-11 and caspase-11. c Cells were treated with Ang II (1 μmol/L) for 24 h. Cleaved IL-1β was analyzed by western blotting. d Quantification of IL-1β. *P < 0.05 versus control. e Cells were stimulated with IL-1β (20 ng/mL) for 48 h. The levels of TGF-β, fibronectin, and collagen I were analyzed by western blotting. f Quantification of TGF-β, fibronectin and collagen I. Data are presented as the mean ± SEM (n = 6). *P < 0.05 versus control. **P < 0.01 versus control

