Fig. 1.
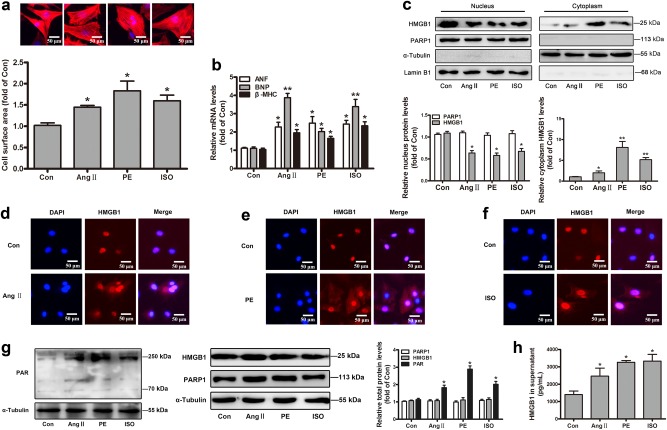
Changes of PARP1 and HMGB1 in the hypertrophic cardiomyocytes. NRCMs were incubated with 1 μM Ang II, 100 μM PE, and 10 μM ISO for the times indicated. a After 48 h, the cell surface area was measured by dying with rhodamine-phalloidin in NRCMs. b After 12 h, the mRNA levels of ANF, BNP, and β-MHC were confirmed using real-time PCR analysis. c After 12 h, the nuclear and cytoplasmic protein were extracted respectively from NRCMs, and were observed by Western blot analysis. d–f After 12 h, immunofluorescence (IF) assay was conducted to determine the subcellular distribution of HMGB1. Representative images of five independent experiments are shown. g After 24 h, Western blot analysis was operated to confirm the intracellular protein of PAR, HMGB1, and PARP1. The results were normalized to those of α-Tubulin/Lamin B1 and were presented as the means ± SEM. h ELISA experiment was conducted to measure the level of HMGB1 in cell supernatant. *P < 0.05, **P < 0.01 vs control group, n = 5. Con means control

