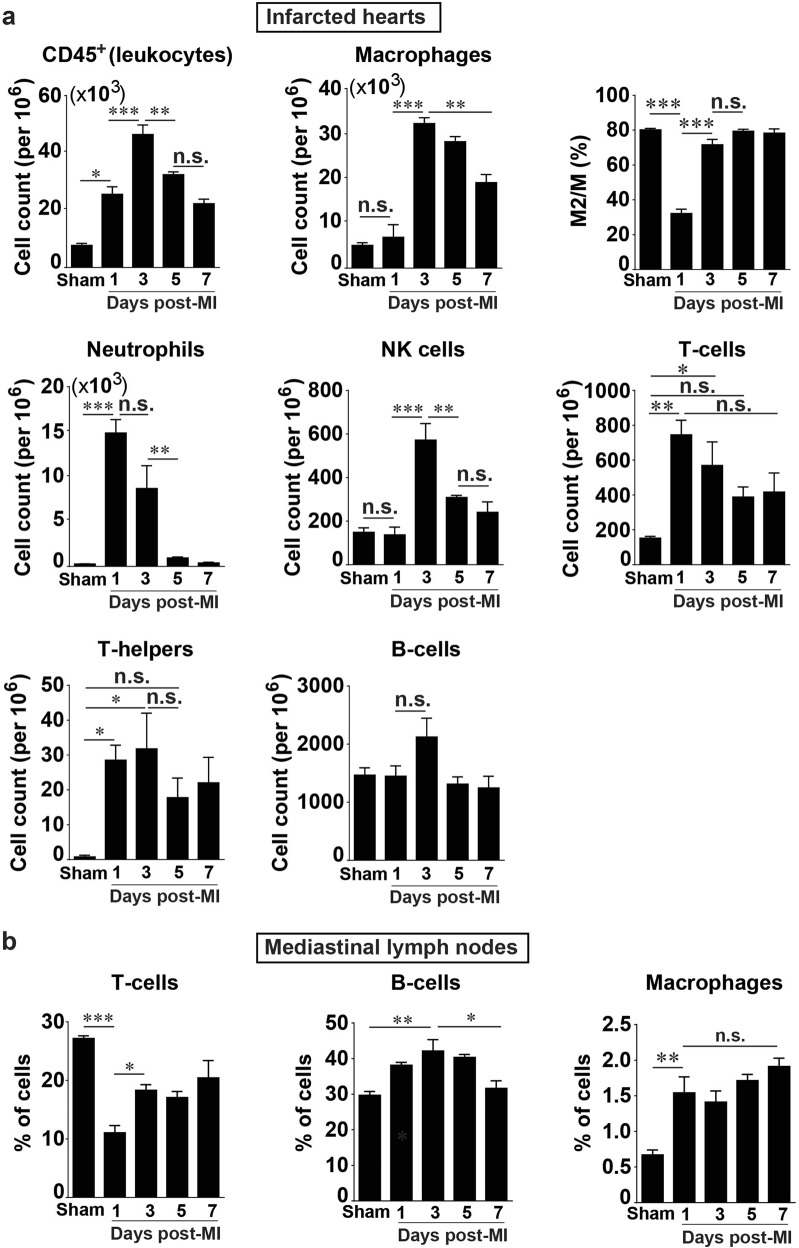
Fig. 3.
Quantification and characterization of the temporal dynamics of immune cells in the heart and mediastinal lymph nodes (MLNs) after prolonged myocardial I/R. a Time course of post-MI changes in the heart (n = 4). b Post-MI dynamics of major immune cell subsets in MLNs. The Y-axis shows percentages of the cell population among 5 × 10⁴ cells from mouse MLN analyzed by flow cytometry (n = 4). Data are shown as the mean ± SE; n.s. means no significance, *P < 0.05, **P < 0.01, ***P < 0.001 as indicated

