Fig. 6.
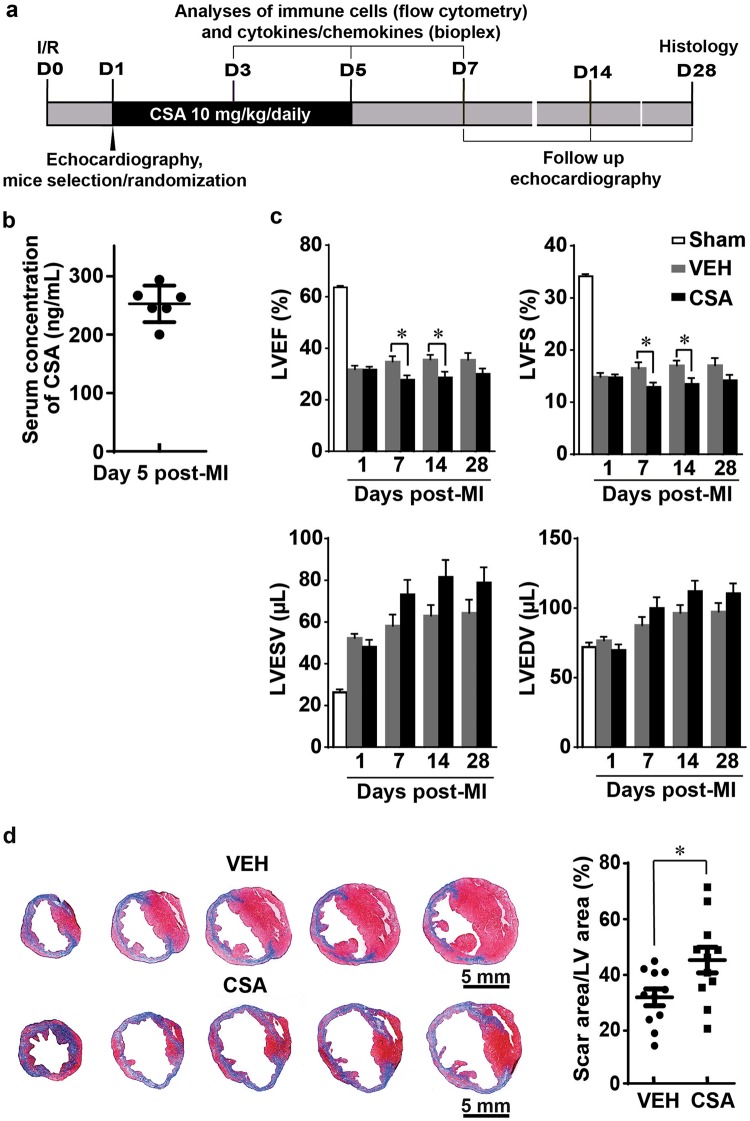
Effect of cyclosporine A (CSA) on the outcome of prolonged myocardial I/R. a Scheme of the experimental design. b CSA concentration in mouse serum during treatment (n = 6). c Comparison of echocardiographic parameters (LVEF, LVFS, LVESV, and LVEDV) between the VEH and CSA groups on the 7th and 14th days after MI (n = 11). d Representative images of Masson’s trichrome staining and average scar areas on post-MI day 28 (n = 11). VEH vehicle (control group), CSA cyclosporine A (treatment group). Data are shown as the mean ± SE; *P < 0.05 as indicated

