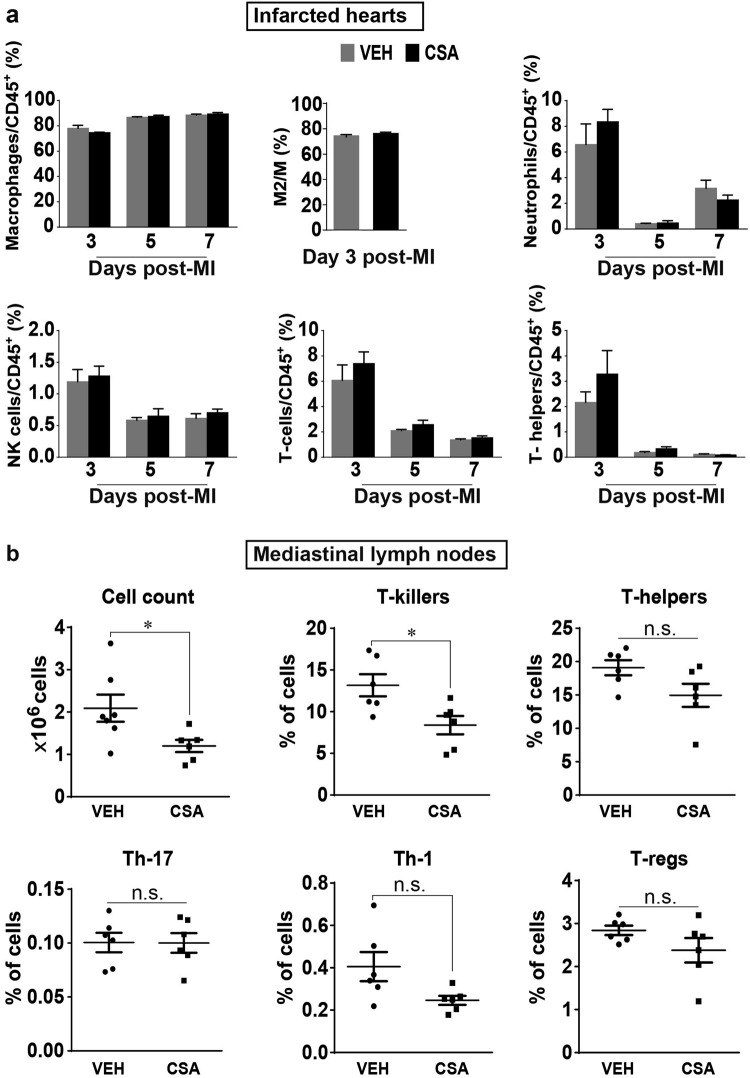
Fig. 7.
Effects of CSA on the number of immune cells in the infarcted heart and MLNs in prolonged myocardial I/R. a Comparison of the changes in the infarcted heart. The Y-axis shows the ratio (%) of cells of interest to CD45+ cells from the heart of the same mouse subjected to flow cytometry analysis (n = 5–7). b Comparison of the changes in MLNs. The Y-axis (except in the first graph) shows the percentage of the chosen cell population among 1.5 × 10⁵ cells from mouse MLNs analyzed by flow cytometry (n = 6). VEH vehicle (control group), CSA cyclosporine A (treatment group). Data are shown as the mean ± SE; n.s. no significance, *P < 0.05 as indicated

