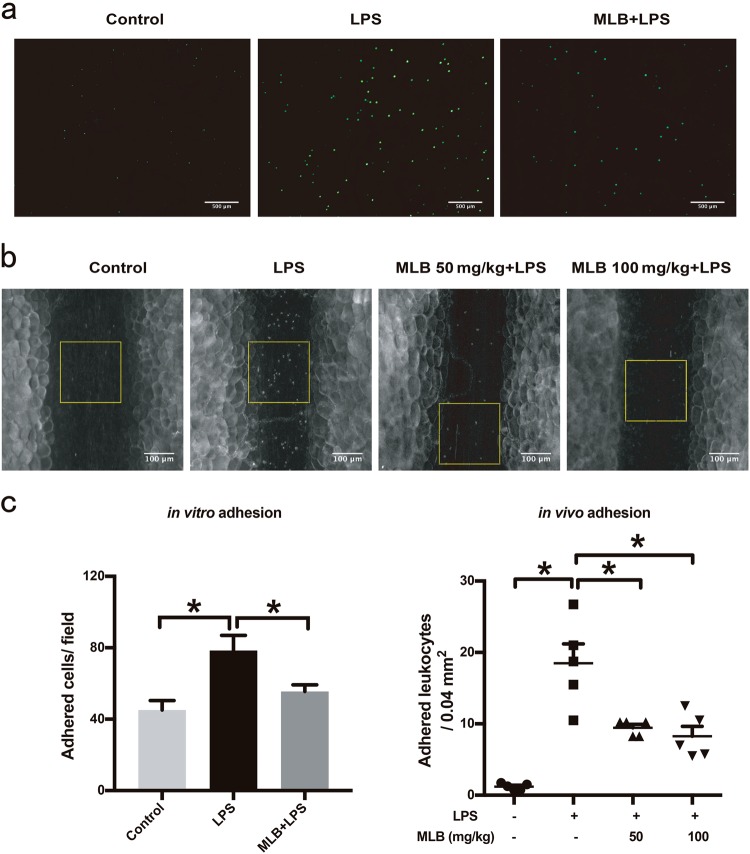
Fig. 2.
a Representative images of THP-1 adhesion to an HMEC-1 monolayer. HMEC-1 cells were treated with 100 μM MLB for 12 h and then stimulated with 1 μg/mL LPS for 6 h. The number of adherent THP-1 cells per microscopic field was determined by fluorescence microscopy. Scale bar = 500 μm. b Representative images of leukocyte adhesion to endothelium in mesenteric venules observed by intravital fluorescence microscopy. Yellow squares represent 0.04-mm2 counting fields. Representative videos of the above results are included in the supplementary information. Scale bar = 100 μm. c Statistical analyses of leukocyte adhesion in vitro and in vivo. For in vitro adhesion experiments, the total number of adherent THP-1 cells was counted in five randomly selected optical fields per well. Data are expressed as means ± SEM of five independent experiments. For in vivo adhesion experiments, adherent leukocytes, defined as those with no visible movement for 30 s, were counted in a 0.04-mm2 field. Data are expressed as means ± SEM (n = 5 animals/group, *P < 0.05

