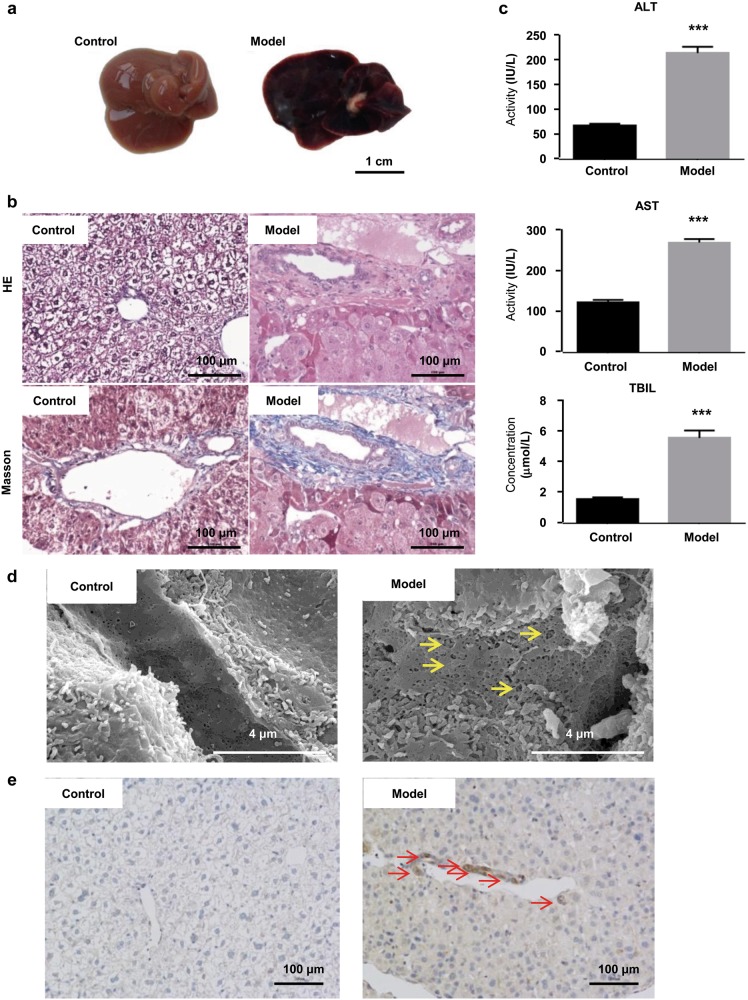
Fig. 1.
Evaluation of the HSOS mouse model established by 40 successive days of administration of Gynura Rhizoma, i.e., 1.0 g total extract/kg per day (equal to 16.7 g crude drug/kg per day based on the extraction rate and 49.1 mg PAper daykg per day based on the total PA content in the extract). a Images of liver tissues (bar is 1 cm). b HE and Masson staining of liver tissues (400× magnification, bar is 100 μm). c Serum ALT and AST activities and TBIL levels. d Scanning electron microscopy images of liver tissues (40,000× magnification, bar is 4 μm). Yellow arrows indicate dilatation of sinusoids, enlarged and damaged fenestrae, and severe congestion. e MMP9 immunohistochemical staining of liver tissues (400× magnification, bar is 100 μm). Red arrows indicate MMP9-positive cells in the hepatic sinusoid and central vein. Values are expressed as the mean ± SD (n = 12). Statistics were analyzed by paired t-test. ***P < 0.001 vs. control group. Six fields were randomly selected and observed for each sample

