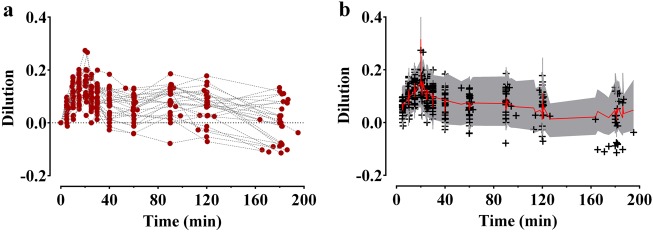
Fig. 1.
Plasma dilution (a) during and after intravenous infusion of 1000 mL of Ringer’s lactate solution over 20 min in 27 patients undergoing open gastrectomy and predictive checks (b) of the final pharmacokinetic model for Ringer’s lactate solution. The red solid line and shaded areas indicate the 50% prediction line and 90% prediction intervals, respectively. +: observed dilution. The time point at which 1000 mL of Ringer’s lactate solution was initiated was set as the reference time 0

