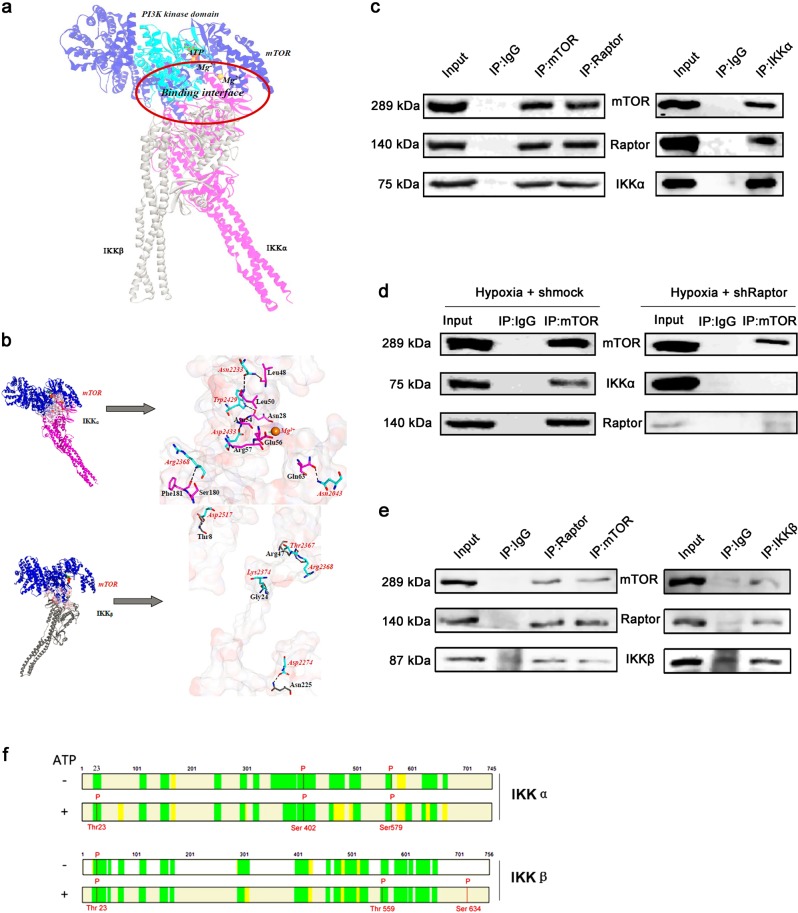
Fig. 3.
mTORC1 interacts with and phosphorylates IKKα and IKKβ separately. a Superimposition of the binding poses of IKKα and IKKβ with mTOR. IKKα and IKKβ are shown in pink and gray, respectively. mTOR is shown in blue, with its PI3K kinase domain (residues 2182–2516) in cyan. ATP and Mg2+ ions are represented by sticks and spheres. b Key residues within the binding interfaces of the mTOR-IKKα and mTOR-IKKβ complexes. The Connolly surface of the binding interface was colored according to its electrostatic potential using Discovery Studio scripts. The key residues are shown as sticks. The C atoms are colored cyan, pink, and gray for mTOR, IKKα, and IKKβ, respectively. The H, N, and O atoms are colored white, blue, and red, respectively. The important hydrogen-bonding and electrostatic interactions are shown by dashed black and green lines, respectively. c IP with anti-mTOR and anti-Raptor antibodies and immunoblotting with an anti-IKKα antibody (left panel) and IP with an anti-IKKα antibody and immunoblotting with anti-mTOR and anti-Raptor antibodies (right panel) using PASMCs cultured under hypoxic conditions. d IP with an anti-mTOR antibody and immunoblotting with an anti-IKKα antibody using PASMCs treated with shMock (left panel) or shRaptor (right panel) and cultured under hypoxic conditions. e IP with anti-mTOR and anti-Raptor antibodies and immunoblotting with an anti-IKKβ antibody (left panel) and IP with an anti-IKKβ antibody and immunoblotting with anti-mTOR and anti-Raptor antibodies (right panel) using PASMCs cultured under hypoxic conditions. f In vitro kinase assay using active mTOR and IKKα or IKKβ. Mass spectrometry was performed to identify the phosphorylation sites (n = 5)

