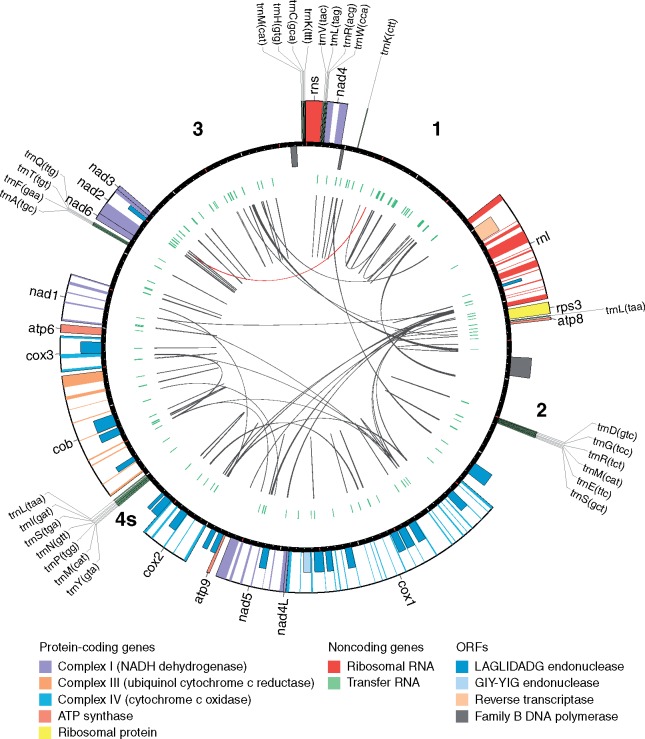
Fig. 1.
—Genetic map of Phellinus noxius KPN91 mitogenome. The first base is defined as the start of rns gene. The ticks on the circle are separated by 1 kb. The boxes adhered to the circle are genes and the half-sized boxes are predicted ORFs. The boxes at outside and inside the circle indicates the genes encoding on positive and negative strand, respectively. Colored regions are exons. In the inner circle, green tiles represent the tandem repeats and the black and red links represent the direct and palindromic repeats, respectively. The bold numbers indicated the four defined intergenic regions (1–3 and 4s). The plot was generated using Circos software (Krzywinski et al. 2009).

