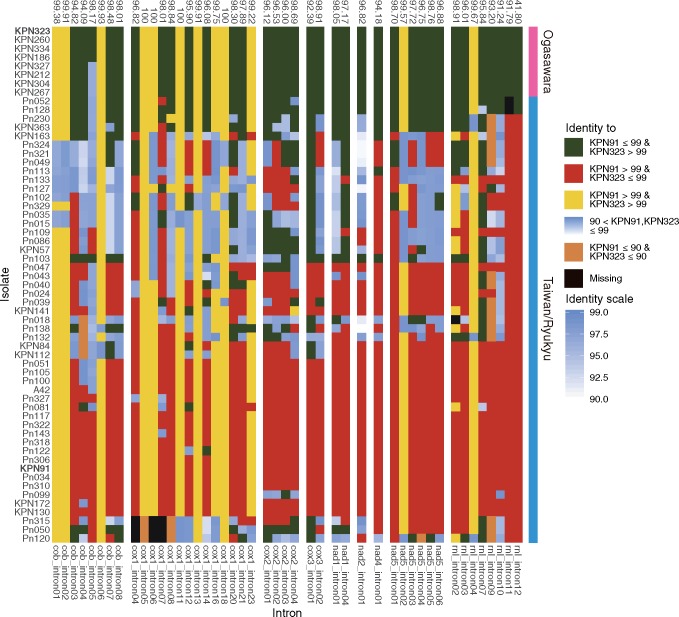
Fig. 6.
—Heatmap of intron identity against KPN91 and KPN323. Intron positions with all identity >99% against KPN91 are removed. The numbers above the chart indicate the intron identity between KPN91 and KPN323. The tiles on the right of the chart are the lineages defined by intron pattern and intronic phylogeny. The y axis is the order of intronic phylogeny (supplementary fig. S6, Supplementary Material online).

