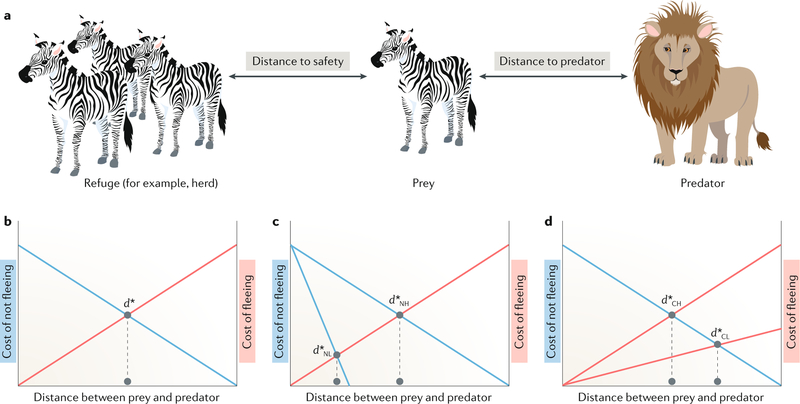
Fig. 2 |. Example of foraging and escape choice, and the cost-of-fleeing and cost-of-staying curves.
a | The solitary prey (for example, a zebra) must make a decision about whether to flee to safety when a predator is approaching (for example, a lion). The flight initiation distance (FID) is the measurable distance at which the prey makes the decision to flee from an approaching threat2. The FID is influenced by several factors, including the degree of threat posed by the predator (for example, whether it is a fast-moving or slow-moving predator) and the value of its current location (for example, there is an abundance of food or mates). b | The schematic represents the cost of fleeing versus remaining and is based on the model proposed by Ydenberg and Dill76. As the distance between the prey and the predator decreases, the cost of fleeing decreases (red line), whereas the cost of not fleeing increases (blue line). d* represents the optimal distance between the prey and the predator at which the prey should flee. c | In situations in which there are multiple benefits of remaining at a particular patch but a single cost of fleeing, d* is longer for the higher of the two cost-of-not-fleeing curves. d | Conversely, d* is longer for the lower of the two cost-of-fleeing curves when there is a single cost-of-not-fleeing curve2. d*CH, high cost; d*CL, low cost; d*NH, not fleeing, high cost; d*NL, not fleeing, low cost. Adapted with permission from REF.2,Cambridge University Press.

