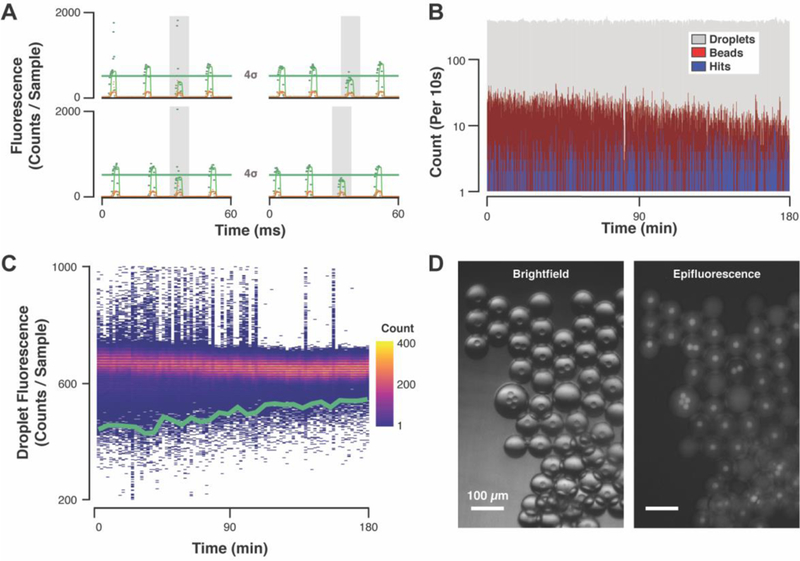
Figure 3. Microfluidic activity-based screening data.

(A) Laser-induced fluorescence traces of hit droplets contain raw data for ATX activity assay signal (520 nm, green points), raw internal standard signal (570 nm, orange points), and median-smoothed data for both channels (green and orange lines). The autofluorescent library beads occasionally pass through the confocal volume, resulting in fluorescence signal spikes (see top and bottom left traces) that are smoothed to identify droplet peak fluorescence, but also used to monitor bead introduction. If a droplet peak fluorescence falls below the sorting threshold (green lines), it is sorted into the hit collection. For each droplet, the mean (μ) and standard deviation (σ) of the previous 1,000 droplet peak fluorescence values is calculated to establish the sorting threshold (μ - 4σ). (B) Droplet generation and hit droplet identification rates were uniform while bead-induced fluorescence signal spikes steadily decreased over the 3 h screen. (C) Hit distribution and negative droplet fluorescence uniformity are visualized in a heat map of binned droplet fluorescence signals (120-s bins) overlaid with sorting threshold (green line). (D) An example hit collection imaged in brightfield and epifluorescence (λex = 470 nm, λem = 525 nm) contains droplets of variably attenuated activity assay signal.
