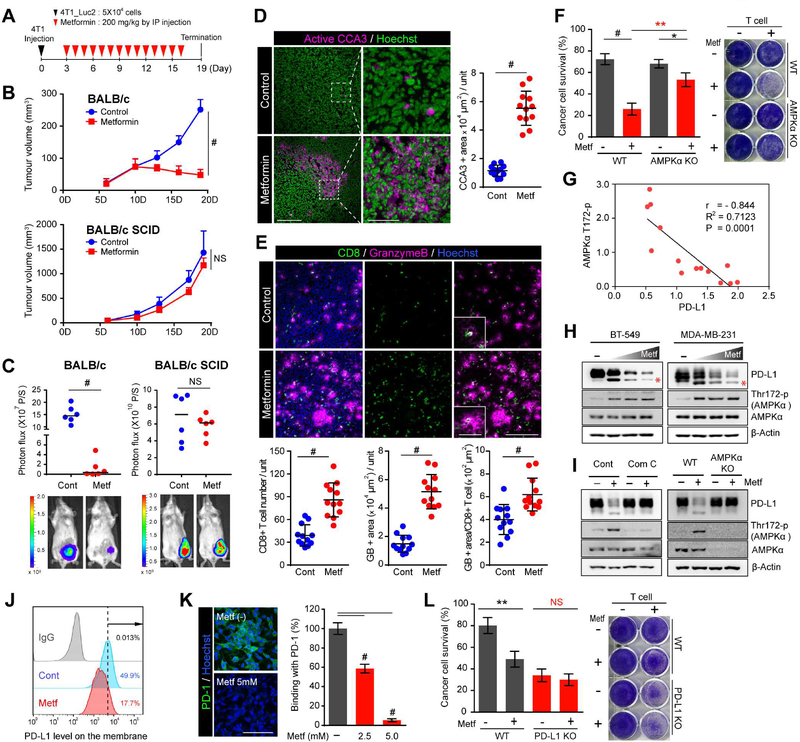
Figure 1. Metformin increases CTL activity through the AMPK/PD-L1 axis.
(A) 4T1_luc2 cells were injected into mice (n = 6 mice per group) on day 0, and metformin administered as indicated. (B) Tumor volume was measured on the indicated time points. Data represent mean ± SD. (C) Quantification (top) of bioluminescence imaging. Bottom, endpoint images shown (D) Immunostaining of cleaved caspase 3 in the 4T1 tumor mass. Hoechst: nuclear counter staining (pseudo-color: green). Scale bar, 200 μm (inset, 50 μm). (E) Immunostaining of CD8 (CTL marker) and granzyme B (activity of T cell) in the 4T1 tumor mass. Scale bar, 200 μm (inset, 50 μm). For (D) and (E), data represent mean ± SD. n = 12; 3 tissue slides per tumor, 4 mice per group. Unit = 466,038 μm2 in (D) and 262,144 μm2 in (E). (F) T cell-mediated cancer cell killing assay. MDA-MB-231 WT and AMPKα KO cells co-cultured with activated T cell for 48 hr with or without metformin (5 mM) were subjected to crystal violet staining. MDA-MB-231 to T-cell ratio, 1:5. Data represent mean ± SD. n = 3. (G) Correlation analysis between PD-L1 and AMPKα T172-p expression in 14 breast cancer cell lines. (H) BT-549 and MDA-MB-231 were treated with increasing concentrations of metformin (1.25 to 5 mM) for 24 hr. (I) MDA-MB-231 parental, AMPKα WT and KO cells were treated with metformin (5 mM) for 24 hr. Compound C (Com C) AMPK inhibitor was pretreated 6 hr before metformin treatment. (J) Membrane PD-L1 expression by flow cytometric analysis after metformin (5 mM) treatment for 24 hr. (K) Right, quantitation of binding of green fluorescent-labeled PD-1/Fc on MDA-MB-231 treated with or without metformin for 24 hr. Data represent mean ± SD. n = 3. Left, representative images shown. Scale bar, 100 μm. (L) MDA-MB-231 WT and PD-L1 KO cells co-cultured with activated T cells for 48 hr with or without metformin (5 mM) were subjected to crystal violet staining. MDA-MB-231 to T- cell ratio, 1:3.
*P, 0.01~0.05, **P, 0.001~0.01, #P, < 0.001, and NS, not significant, Student’s t test.

