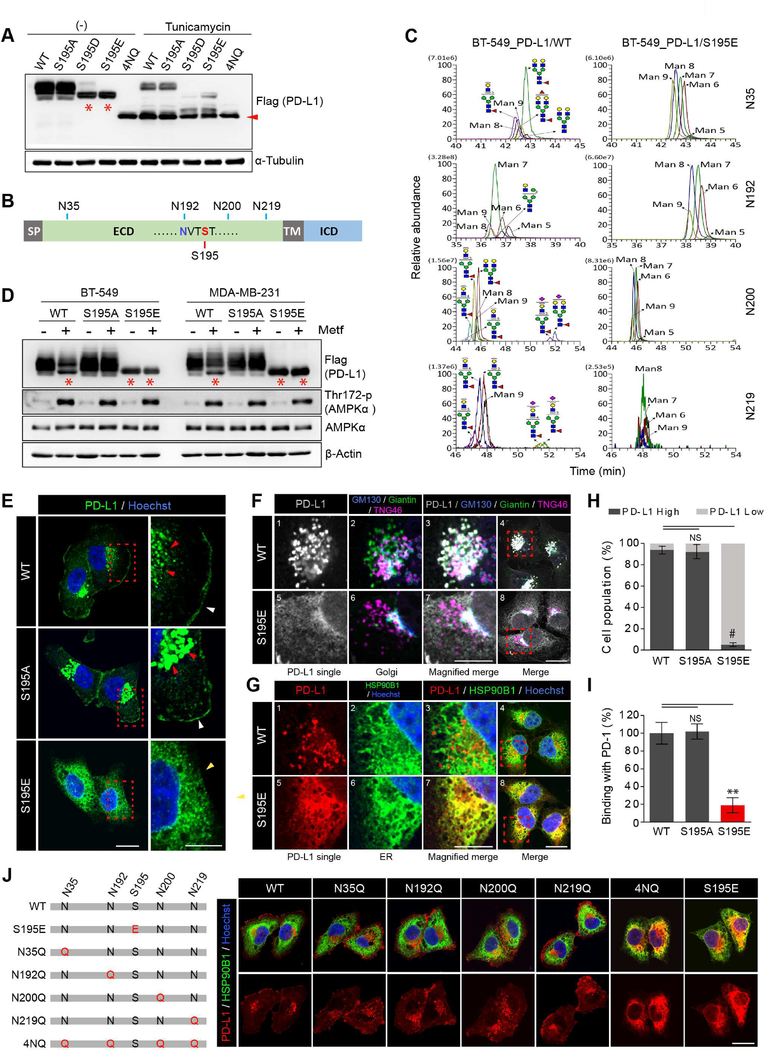
Figure 3. Phosphorylation of PD-L1 S195 induces its abnormal glycosylation and blocks its ER-to-Golgi translocation.
(A) WT, S195A S195D, S195E, and 4NQ PD-L1 stable cells were treated with or without tunicamycin (5 μg/ml) for 24 hr. (B) Schematic diagram of PD-L1 showing the position of S195 and the 4 N-glycosylation sites. (C) Comparison of the glycan structure between WT and S195E PD-L1 by IP/Mass analysis. (D) BT-549 and MDA-MB-231 stable cells expressing WT, S195E, or S195A PD-L1 were treated with metformin (5 mM) for 24 hr. (E) Expression pattern of PD-L1 in MDA-MB-231 WT, S195A and S195E PD-L1 stable cells by IF staining. (F) MDA-MB-231 stable cells co-stained with antibodies against PD-L1 and Golgi markers (GM130: cis, Giantin: medial, TNG46: trans). (G) IF staining with antibodies against PD-L1 and ER marker (HSP90B1) (H) Flow cytometric analysis of membrane PD-L1 in MDA-MB-231 WT, S195A and S195E PD-L1 stable cells. Data represent mean ± SD. n = 3. (I) Binding of green fluorescent-labeled PD-1/Fc to MDA-MB-231 WT, S195A and S195E PD-L1 stable cells was quantified. Data represent mean ± SD. n = 3. (J) PD-L1 localization in MDA-MB-231 expressing WT, S195E or NXT motif mutant (glycosylation site mutant) PD-L1 by IF staining. For experiments shown in (E), (F), (G) and (J), MG132 (10 μM) was added 6 hr prior to fixation to prevent degradation of PD-L1. Hoechst: nuclear counter staining. Scale bar, 20 μm (inset, 10 μm). *P, 0.01~0.05, **P, 0.001~0.01, and #P, < 0.001, Student’s t test. NS, not significant.

