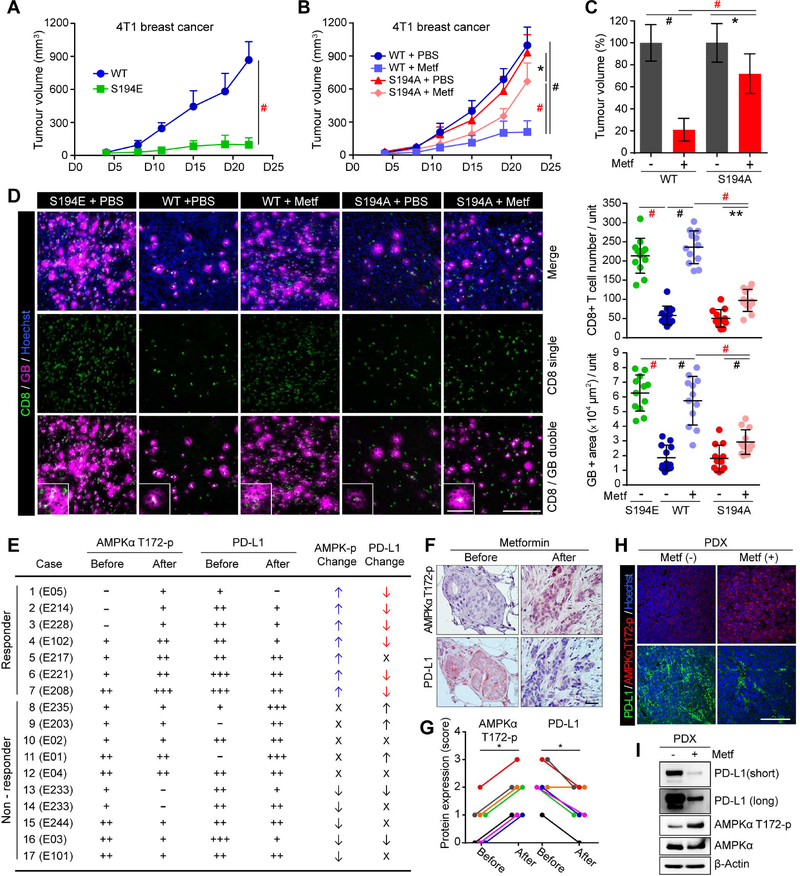
Figure 5. The reduction of PD-L1 by metformin-activated AMPK is physiologically significant and clinically relevant.
(A) 4T1 WT or S194E mPD-L1 stable cells (5 × 10⁴) were injected into BALB/c mice (n = 7 mice per group) (B) 4T1 WT or S194A mPD-L1 stable cells (5 × 10⁴) were injected into BALB/c mice (n = 7 mice per group) on day 0, and metformin (200 mg/kg) administered by i.p. injection starting at day 4 for 18 days. Tumor volume was measured on the indicated time points. Data represent mean ± SD. (C) The relative tumor volume (%) at the end point (day 22) of panel (B). (D) Left, representative images of immunostaining of CD8 and GB in the 4T1 tumor mass. Hoechst: counter staining. Right, CD8 and GB were quantified using Image J. Data represent mean ± SD. n = 12. Three tissue slides per tumor, 4 mice per group. Unit = 262,144 μm2. (E) AMPKα T172-p and PD-L1 levels before and after metformintreatment in tumor tissues of breast cancer patients. −, score 0; +, score 1; ++, score 2; +++, score 3; ↑, up; ↓, down; X, no change. (F) Representative IHC images of the cases shown in panel (E). Scale bar, 50 μm. (G) Plot of IHC scores of AMPKα T172-p and PD-L1 expression levels in responders before and after metformin treatment. n = 7 (H) PBS and metformin were administered to a pair of SCID mice with same patient tumor for 7 days. Immunostaining of AMPKα T172-p and PD-L1 in the PDX tumor mass. Hoechst:counter staining. Scale bar, 200 μm. (I) Western blotting of lysates from PDX tumors in (H) with the indicated antibodies.
*P, 0.01~0.05, **P, 0.001~0.01, and #P, < 0.001, Student’s t test.

