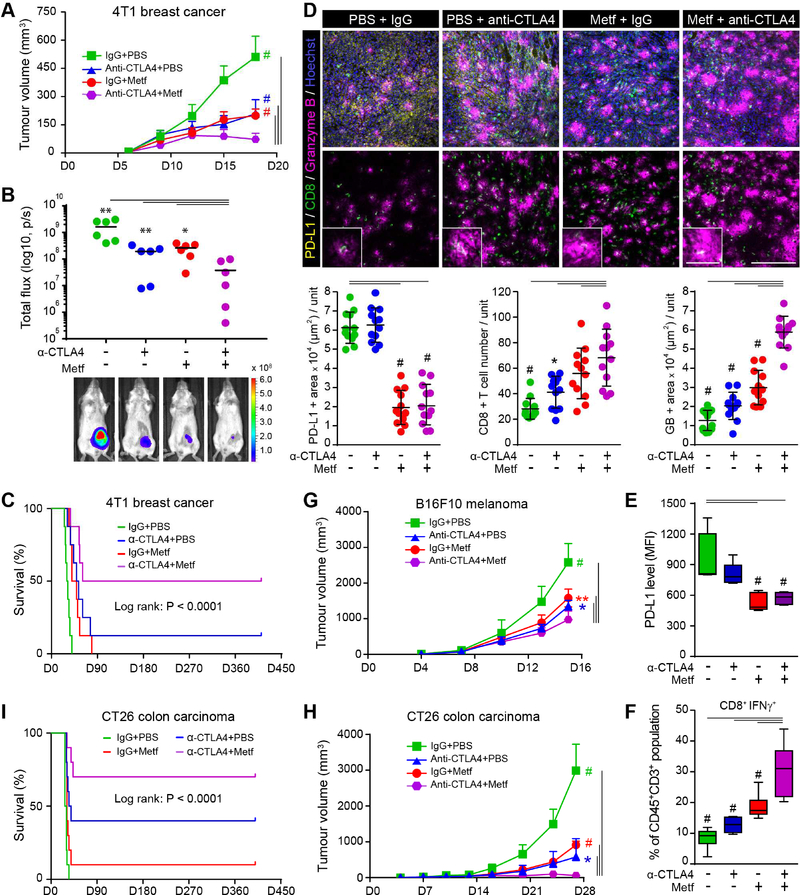
Figure 6. The combination of metformin and CTLA4 blockade effectively suppresses tumor growth in vivo.
(A) Tumor growth of 4T1 cells in immunocompetent BALB/c mice treated with control, metformin, anti-CTLA4, or the combination. Data represent mean ± SD. n = 8 mice per group. (B) Quantification (top) of bioluminescence imaging (endpoint images shown). The maximum and minimum values were excluded for more accurate analysis. Data represent mean ± SD. n = 6 mice per group. (C) Survival of mice bearing 4T1-derived tumor following treatment with control, metformin, anti-CTLA4, or the combination. n = 8 mice per group, log-rank test. (D) Top, immunostaining of PD-L1, CD8, and GB in the 4T1 tumor mass. Hoechst: nuclear counter staining. Scale bar, 50 μm (inset, 200 μm). Bottom, quantification of PD-L1, CD8, and GB using Image J. Data represent mean ± SD. n = 12 (4 mice per group). Three tissue slides per tumor. Unit = 182,047 μm2. (E) Cells were extracted from 4T1-tumors by Percoll density gradient centrifugation. PD-L1 levels on extracted cells were evaluated by FACS. Cells were gated based on the FSC (forward scattered light) vs. SSC (side-scattered light). Membrane PD-L1 is shown as median fluorescence intensity (MFI). Data represent mean ± SD. n = 5 per group. (F) FACS analysis of CD45+CD3+CD8+ CTL activity as indicated by the activity intracellular IFN-γ in the leukocyte fractions from Percoll density gradient separation. Detailed gating information is shown in Figure S6B. Data represent mean ± SD. n = 7 per group. Two or three tumors were collected for one sample for the combination group. (G) Tumor growth of B16F10 melanoma cells in immunocompetent C57BL/6J mice treated with control, metformin, anti-CTLA4, or the combination. Data represent mean ± SD. n = 6 mice per group. (H) Tumor growth of CT26 colorectal cancer cells in immunocompetent BALB/C mice treated with control, metformin, anti-CTLA4, or the combination. Data represent mean ± SD. n = 6 mice per group. (I) Survival rate of mice bearing CT26-derived tumor following treatment with control, metformin, anti-CTLA4, or the combination. n = 10 mice per group, log-rank test.
*P, 0.01~0.05, **P, 0.001~0.01, and #P, < 0.001, Student’s t test.

