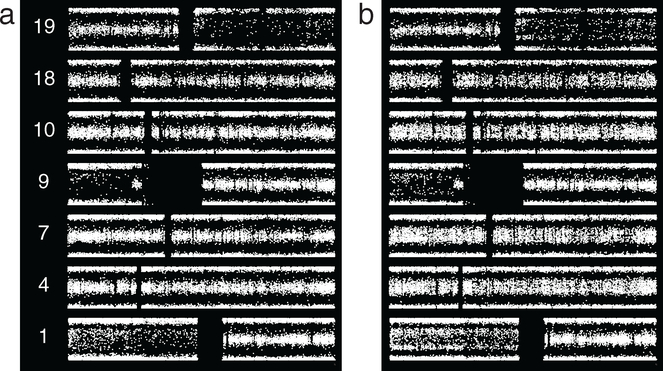
Figure 6.
Grade II ODG from one patient, resections separated by approximately 6 years. (a) Case 2_19 shows 1p/19q, along with broad splitting of BAF on most of 9p. (b) Case 2_22 shows these abnormalities, with suggested thin splitting on 4pq, 7pq, 10pq, and possibly 18pq. Values for 1p, 19q, and 9p indicate lower purity of the more recent sample. The abnormalities suggested in the second resection likely arose and/or propagated in the interval between cases.

