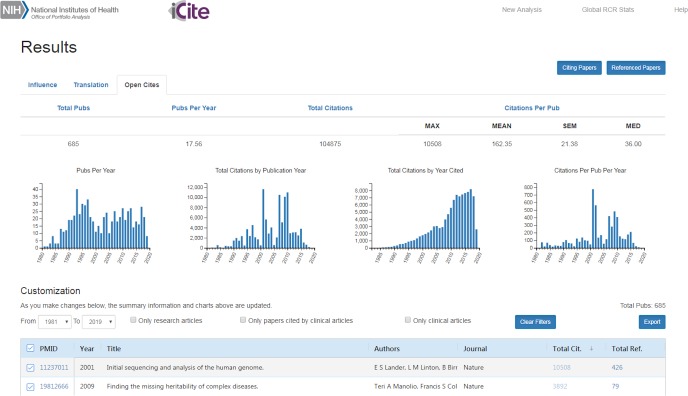
Fig 2. Screen capture of the iCite web interface to open citation data.
The Open Citations module of iCite displays portfolio-level data in a summary table (top) and charts beneath the table. Charts provide visualization of publications over time (left), total citations per year by the publication year of the referenced article (center left), total citations per year by the publication year of the citing article (center right), and average citations per article in each publication year (right). Article-level information is shown on bottom and includes links to the PubMed records of the citing and referenced papers.

