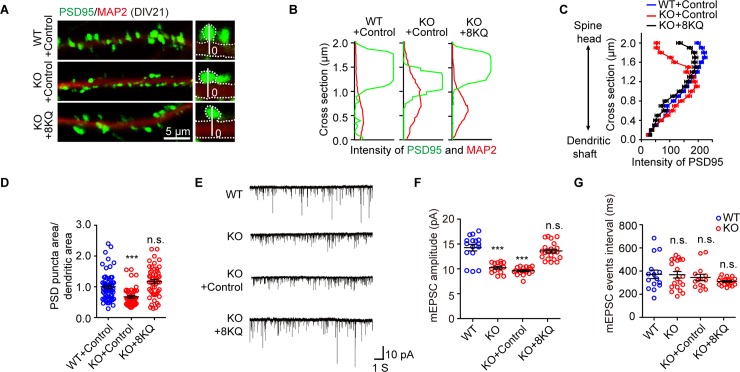
Fig 6. Acetylation mimetic cortactin rescues synaptic defects.
(A) Representative image of dendritic segments of cultured neurons infected at DIV15 with Lv-eGFP (control) or Lv-eGFP-cortactin 8KQ, and imaged at DIV21. The right insets showing an example of the quantitative analysis of PSD95 distribution along the 2-μm vertical white line, which proceeds from the base of the dendritic shaft (set as 0) to the outline of PSD95. (B) Traces illustrating the fluorescence intensity of PSD95 (green) along the scanning path in (A). (C) Quantitative analysis of the distribution of PSD95. (D) Scatterplot graph showing the area ratio of PSD95-positive puncta to the total dendritic area (MAP2). Data from 4 independent experiments and represented as mean ± SEM; WT + control = 64 neurons, KO + control = 46 neurons, KO + 8KQ = 51 neurons; one-way ANOVA, F2, 158 = 16.56; post hoc LSD, ***P < 0.0001, n.s. P = 0.0513, related to WT + control. (E) Representative whole-cell voltage clamp traces of mEPSC from cultured neurons held at −70 mV. (F) Scatterplot graph showing mEPSC amplitude. Lv-eGFP-cortactin 8KQ infection of Dip2a KO neurons at DIV10 rescued the aberrant mEPSC amplitude (n = 16, 14, 18, and 21 neurons, respectively; data from 3 independent experiments; one-way ANOVA, F3, 65 = 34.16; post hoc LSD, ***P < 0.0001, n.s. P = 0.1521). (G) Scatterplot graph showing the equivalent mEPSC frequency (one-way ANOVA, F3, 61 = 1.01, P = 0.13946; post hoc LSD, n.s. P > 0.05). The underlying data for this figure can be found in S1 Data. DIV, day in vitro; KO, knockout; LSD, least significant difference; Lv-eGFP, lentivirus carrying enhanced green fluorescent protein tag; MAP2, microtubule-associated protein 2; mEPSC, miniature excitatory postsynaptic current; n.s., no significance; PSD, postsynaptic density; WT, wild-type; 8KQ, acetylation mimetic cortactin with eight lysine replaced with glutamine.

