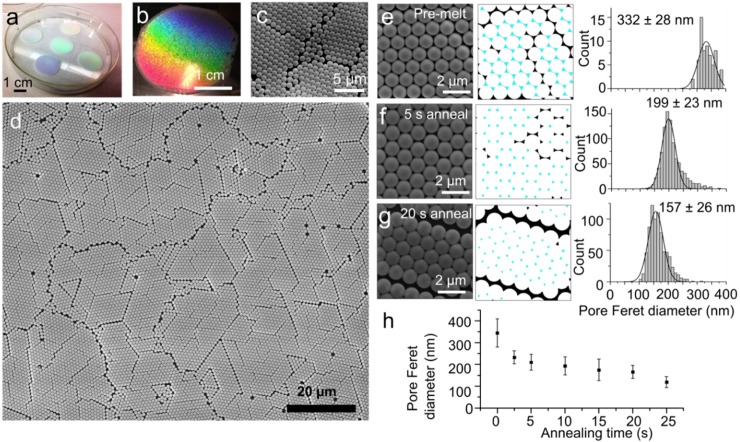
Fig 2. Annealing of 2D crystalline arrays of polystyrene beads.
Macroscopic images of 2D crystalline arrays of polystyrene beads displaying rainbow structural coloration (a,b) and SEM images of the hexagonal arrays (c,d). SEM images of beads that were not heated (e), or were heated at 107°C for 5 s (f) or 20 s (g), with corresponding interstitial areas selected (cyan) and maxFeret diameter histograms for the measured areas. (h) Interstitial maxFeret diameter from SEM images as a function of melting time. Error bars represent standard deviations.

