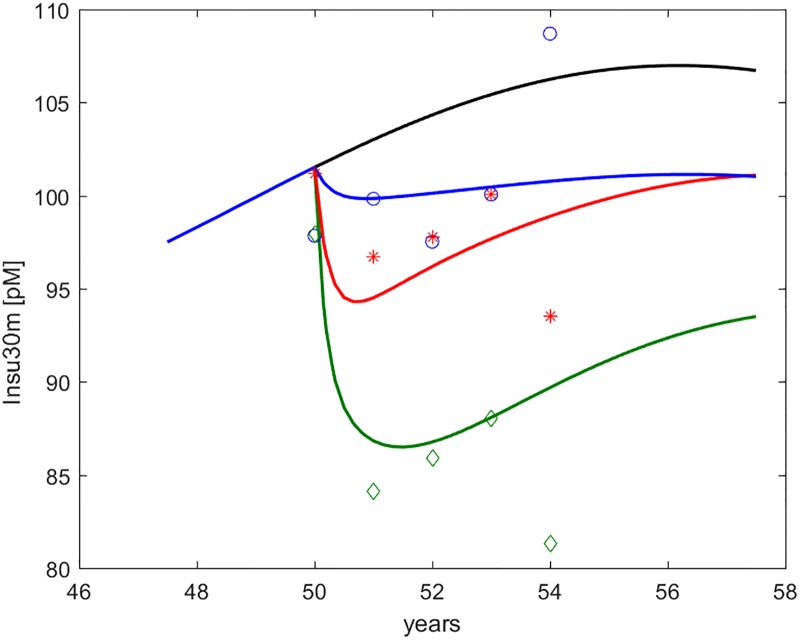
Fig 6. Insulinemia at 30’ during OGTT (I30m, indicated as Insu30m).
Time course of predicted and observed average Serum Insulin at 30 minutes during OGTT, around the period of study. The four curves refer to no intervention (black), Placebo (blue), Metformin (red), Intensive LifeStyle (green). The data points refer to Diabetes Prevention Program (DPP) study means for Placebo (blue circles), Metformin (red asterisks) and Intensive LifeStyle modification (green diamonds).

