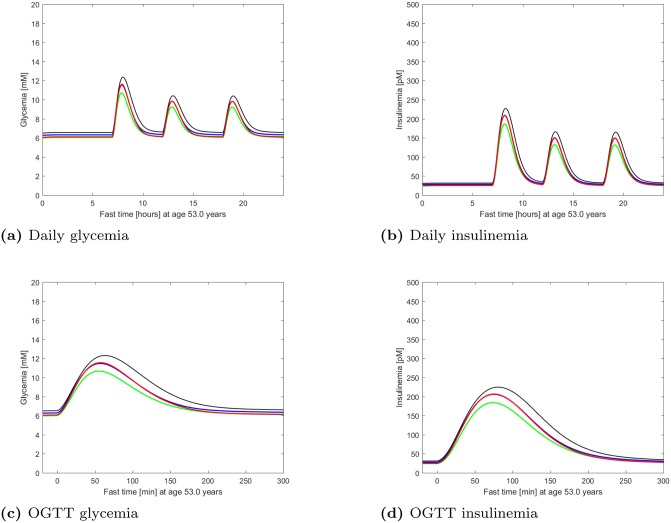
Fig 7. Fast glycemia and insulinemia.
Time course of glycemia and insulinemia as predicted by the model for a representative virtual DPP subject, studied at age 53, during a simulated whole day (top panels) and a simulated OGTT (bottom panels). The curves refer to no intervention (black), Placebo (blue), Metformin (red), Intensive LifeStyle (green). Notice how the glycemic curve under Metformin tends to coincide with Intensive LifeStyle at fasting and with Placebo under glucose load.

