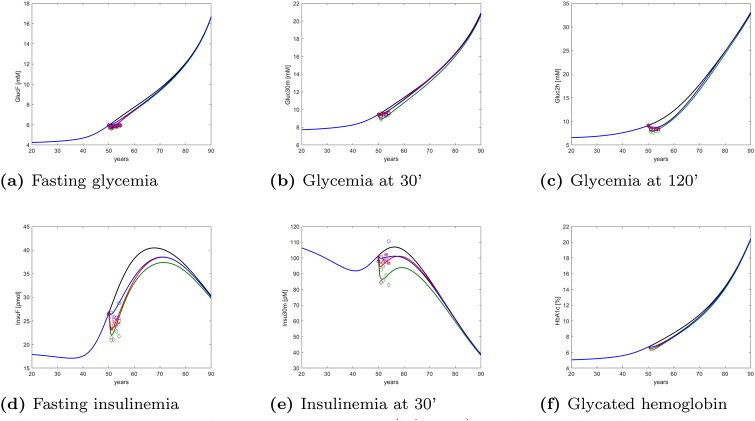
Fig 13. Long-term changes.
Long-term (lifetime) model-predicted changes in DPP-measured variables and in HbA1c for the three DPP treatment arms. The curves refer to no intervention (black), Placebo (blue), Metformin (red), Intensive LifeStyle (green). Top panels refer to glycemia (from left to right fasting glycemia, glycemia at 30 minutes during OGTT and glycemia at 2 hours during OGTT). Bottom panels are, from left to right, fasting insulinemia, insulinemia at 30 minutes during OGTT, glycated hemoglobin.

