
Fig 1. Sensitivity values of a 10-fold stratified cross-validation run.
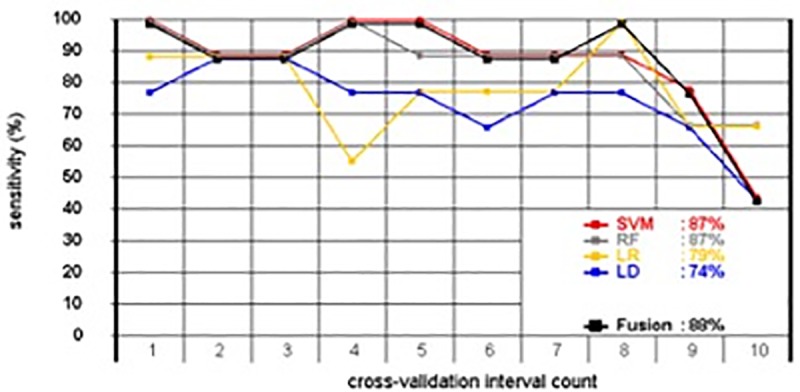
Data set 1 (RD versus NRO). The single diagnosis of the four different classifiers and their corresponding probabilities were evaluated by a further classifier, which computed the final diagnosis. For the fusion, a support vector machine (SVM, black line) was selected, because it performed best. For a better reading of the curves are shifted vertically with a few pixels.