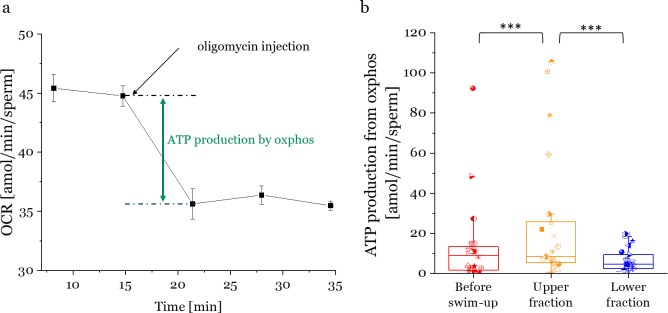
Fig 4. ATP production by oxidative phosphorylation of different swim-up fractions.
a) ATP production from oxphos is calculated as the difference between basal OCR rate and OCR rate after oligomycin injection. b) Average ATP production due to oxphos of unselected sperm (before-swim-up), upper and lower swim-up fractions. Each box contains data from 12 bulls. Horizontal lines through each box are the median values, lower and upper limits are 25th and 75th percentile, respectively.

